

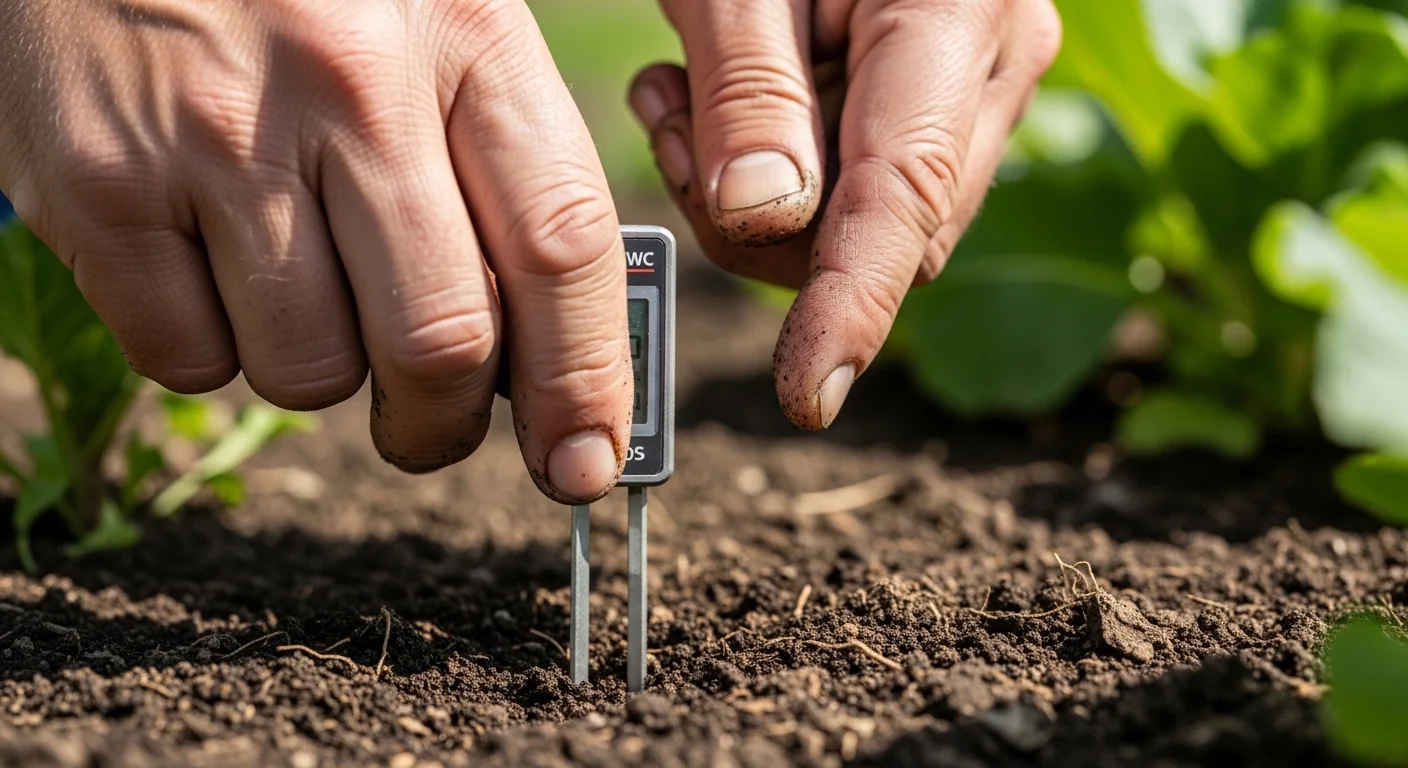
Soil moisture management fails most often not at the hose or the controller, but at the threshold no one can see: the permanent wilting point. At that boundary, soil water is bound in microscopic clay pores at 1500 kilopascals of capillary tension. Plant roots generate roughly 15 atmospheres of osmotic suction at their peak, and that tension exceeds it. The water is physically present in the soil, but biologically unreachable. Cell turgor collapses. In fast-growing tissue, that collapse can become irreversible within hours.
This field capacity soil moisture calculator takes three inputs, soil texture, root zone depth, and current soil moisture as either a volumetric water content percentage or a tensiometer kilopascal reading, and returns field capacity, permanent wilting point, available water capacity, the depth of irrigation water required to refill the root zone, and a real-time threshold warning. It does not model crop evapotranspiration rates, rainfall interception, or runoff coefficients. Those variables require separate measurement. Once you have the depth of water needed from this tool, a sprinkler run time calculator converts that figure into a schedule your controller can use.
After running this calculator, you will know whether your soil is above the stress threshold, approaching permanent wilt, or already past it, and exactly how many inches of water are needed to bring the active root zone back to field capacity.
Use the Tool
Soil Field Capacity & VWC Calculator
Calculate volumetric water content, permanent wilting point, available water capacity, and precise irrigation requirements for any soil type.
How This Calculator Works
This tool uses established USDA and FAO soil hydraulic property data to convert your soil moisture readings into actionable irrigation advice.
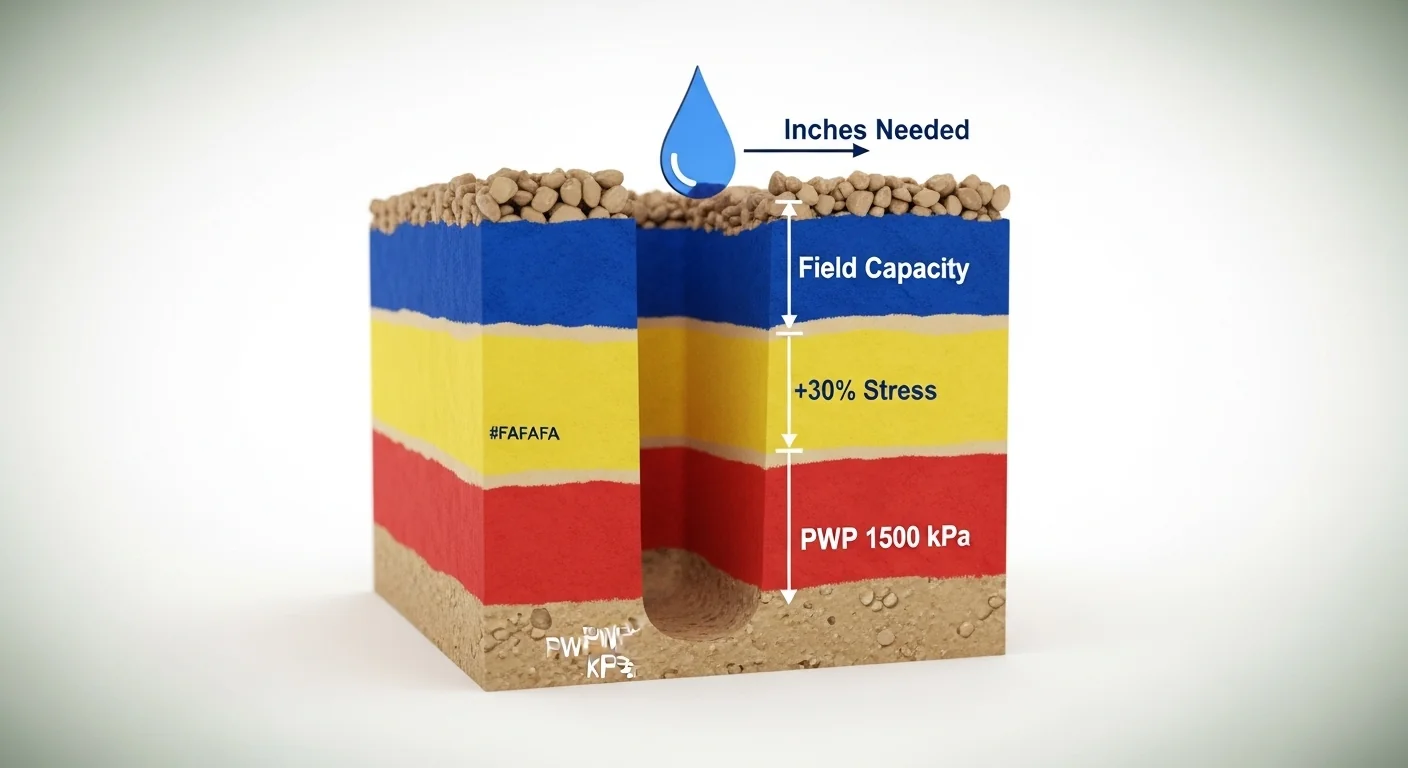
- Field Capacity (FC): The amount of water soil holds after gravity drainage (usually 1/3 bar or 33 kPa).
- Permanent Wilting Point (PWP): The point where plants can no longer extract water (usually 15 bars or 1500 kPa).
- Available Water Capacity (AWC): The difference between FC and PWP (the water actually usable by the plant).
Irrigation Formula:
Inches Needed = ((FC - Current VWC) / 100) × Root Zone Depth
This calculates the exact depth of water required to refill the soil profile back to Field Capacity, preventing wasteful deep percolation or runoff.
Assumptions & Limitations
- Standardized Textures: The FC and PWP values used are averages for standard soil textural classes. Actual field soils may vary based on organic matter, bulk density, and compaction.
- kPa to VWC Conversion: The tensiometer conversion uses a generalized soil-water characteristic curve. For precise tensiometer-based irrigation, you should develop a specific retention curve for your site.
- Root Zone Homogeneity: The calculator assumes uniform moisture throughout the specified root zone depth.
- Irrigation Efficiency: The “Irrigation Needed” value represents the net water required by the soil. It does not account for application efficiency losses (evaporation, wind, system leaks). You may need to apply 10-30% more total water depending on your irrigation system type (drip vs. sprinkler).
[PUT YOUR CALCULATOR WIDGET CODE HERE]
Before entering values, have three things ready: your soil texture classification (a jar shake test or a ribbon test gives a usable estimate if you have no lab report), your root zone depth in inches (measure to the deepest point where roots are actively absorbing water, not just present), and either a current volumetric water content reading from a capacitance probe or a kilopascal reading from a tensiometer. If you are working from a tensiometer, note the time of the reading; morning readings before solar heating give the most stable baseline. How quickly the soil can accept that water once you start irrigating is a separate variable, one addressed by a soil infiltration rate calculator that accounts for surface crust and texture-specific intake curves.
Quick Start (60 Seconds)
- Soil Texture: Choose the USDA textural class closest to your field. When in doubt between two classes, select the finer-textured option; it will give a more conservative wilting point estimate.
- Root Zone Depth: Enter depth in inches, not centimeters. Turf roots typically reach 4 to 8 inches; annual vegetables extend to 12 to 24 inches; established shrubs and fruit trees often reach 24 to 48 inches.
- Moisture Input Mode: Toggle between VWC % and Tensiometer kPa. Do not mix units across a single reading session.
- VWC % entry: Valid range is 0 to 60. Readings above 45 in mineral soils usually indicate sensor error or standing water, not true saturation.
- Tensiometer kPa entry: Valid range is 0 to 1500. At 0 the soil is saturated. At 1500 the permanent wilting point has been reached for most crops. Most commercial tensiometers max out at 85 to 100 kPa due to cavitation; for drier readings, use a pressure plate apparatus or a VWC sensor.
- Click Calculate only after all three fields are filled. The tool will not run on partial inputs and will display an inline error message for any missing or out-of-range value.
- Reset clears all fields and the results panel. Use it before running a new soil scenario rather than overwriting one field at a time.
Inputs and Outputs (What Each Field Means)
| Field | Unit | What It Represents | Common Entry Mistake | Safe Entry Guidance |
|---|---|---|---|---|
| Soil Texture | Category | USDA textural class determining pore size distribution and water retention | Selecting “Loam” as a default when actual texture is Clay Loam | Use a ribbon test or lab report; when uncertain, choose the finer class |
| Root Zone Depth | Inches | Depth of the active root zone where water extraction is occurring | Using total plant height or canopy depth instead of rooting depth | Measure to the deepest layer of active root density, not maximum root extent |
| Current Soil Moisture (VWC %) | % volume/volume | Ratio of water volume to total soil volume, measured by capacitance or TDR probe | Entering gravimetric water content (mass-based) as if it were volumetric | Confirm sensor output units before entry; multiply gravimetric by bulk density to convert |
| Current Soil Moisture (kPa) | Kilopascals | Soil matric potential; the tension at which water is held in pore spaces | Reading the tensiometer during midday solar heating, which raises apparent tension | Record readings before 8 a.m. for baseline accuracy; re-fill tensiometer cup if bubbling |
| Field Capacity (FC) | VWC % | Water retained after gravitational drainage ceases; the upper practical limit for plant-available water | Confusing FC with saturation, which is 5 to 15 percentage points higher | Output only; computed from USDA lookup for selected texture class |
| Permanent Wilting Point (PWP) | VWC % | Lower bound of plant-available water; water below this threshold cannot be extracted by root pressure | Assuming visible wilting always coincides with PWP; canopy wilting can lag by hours | Output only; treat this number as a hard floor, not a soft warning |
| Available Water Capacity (AWC) | VWC % | The band of water between FC and PWP that plants can actually use | Treating AWC as an irrigation target rather than a total reservoir size | Most crop consultants trigger irrigation at 50% AWC depletion, not at PWP |
| Irrigation Water Needed | Inches | Depth of water required to bring the root zone from current VWC to field capacity | Applying this figure directly without adjusting for system efficiency or distribution uniformity | Divide by your system’s distribution uniformity (DU) coefficient to get gross application depth |
Worked Examples (Real Numbers)
Scenario 1: Sandy Loam Vegetable Bed, 18-Inch Root Zone
- Soil texture: Sandy Loam
- Root zone depth: 18 inches
- Current VWC: 12%
From the lookup table: FC = 20%, PWP = 8%, AWC = 12%. Stress threshold = 8 + (12 x 0.3) = 11.6% VWC.
Result: Irrigation needed = (20 – 12) / 100 x 18 = 1.44 inches. Status: Adequate, but at 12% VWC the soil is only 0.4 percentage points above the stress warning zone. A single hot afternoon without irrigation could drop it into the warning band.
At this level, roots are still extracting water normally, but the available reservoir is thin. Scheduling irrigation within 24 hours is appropriate for high-value annual crops.
Scenario 2: Heavy Clay Lawn, 6-Inch Root Zone, Below Wilting Point
- Soil texture: Heavy Clay
- Root zone depth: 6 inches
- Current VWC: 26%
From the lookup table: FC = 42%, PWP = 28%, AWC = 14%.
Result: Irrigation needed = (42 – 26) / 100 x 6 = 0.96 inches. Status: CRITICAL. Current VWC of 26% is below the permanent wilting point of 28%.
Heavy clay soils are especially deceptive because their high FC value creates the impression of a large reservoir, while their equally high PWP means the usable band is narrower than it appears. Tissue that has already lost turgor in meristematic zones may not rehydrate completely even after irrigation.
Scenario 3: Loam Orchard, 36-Inch Root Zone, Tensiometer Reading
- Soil texture: Loam
- Root zone depth: 36 inches
- Current soil moisture: 85 kPa (tensiometer input)
Converted VWC from kPa: piecewise interpolation between the 60 kPa reference point (65% saturation fraction) and the 100 kPa point (55% saturation fraction) at 85 kPa yields approximately 58.5% saturation fraction. Applied to the Loam FC-PWP spread of 15 percentage points: current VWC = 12 + 0.585 x 15 = 20.8%. Stress threshold = 12 + (15 x 0.3) = 16.5%.
Result: Irrigation needed = (27 – 20.8) / 100 x 36 = 2.23 inches. Status: Adequate.
For deep-rooted perennial crops, this level of depletion is within the acceptable management range. Scheduling an irrigation event within 2 to 3 days, sized at 2.23 inches net before efficiency adjustment, keeps the orchard on track without over-applying.
Reference Table (Fast Lookup)
All irrigation-to-refill values assume a 12-inch root zone depth. Scale linearly for other depths (multiply by 1.5 for an 18-inch root zone, by 2 for a 24-inch root zone, and so on). Stress Trigger = PWP + (AWC x 0.3). Irrigation to Refill = AWC / 100 x 12 inches.
| Soil Texture | FC (VWC%) | PWP (VWC%) | AWC (VWC%) | Stress Trigger (VWC%) | Irr. to Refill per 12in Root (in) |
|---|---|---|---|---|---|
| Sand | 10 | 4 | 6 | 5.8 | 0.72 |
| Loamy Sand | 14 | 6 | 8 | 8.4 | 0.96 |
| Sandy Loam | 20 | 8 | 12 | 11.6 | 1.44 |
| Loam | 27 | 12 | 15 | 16.5 | 1.80 |
| Silt Loam | 33 | 14 | 19 | 19.7 | 2.28 |
| Silt | 36 | 16 | 20 | 22.0 | 2.40 |
| Clay Loam | 38 | 21 | 17 | 26.1 | 2.04 |
| Silty Clay | 40 | 25 | 15 | 29.5 | 1.80 |
| Heavy Clay | 42 | 28 | 14 | 32.2 | 1.68 |
How the Calculation Works (Formula + Assumptions)
Show the calculation steps
Step 1: Lookup Field Capacity and Permanent Wilting Point. The tool references USDA textural class averages. FC represents the volumetric water content held after free gravitational drainage has slowed to negligible rates, typically 24 to 48 hours after saturation, corresponding to approximately 33 kPa matric potential. PWP is the VWC at 1500 kPa matric potential, the tension at which root suction in most crops cannot overcome the adhesive forces holding water in fine pore necks.
Step 2: Calculate Available Water Capacity. AWC = FC – PWP. This is the total usable reservoir per unit depth. It does not represent how much water should be applied at once; crop science typically targets replacing 50% AWC depletion to avoid stress.
Step 3: Convert kPa to VWC (if tensiometer mode is selected). The tool uses piecewise linear interpolation across eight reference points spanning 10 kPa (near-saturation) to 1500 kPa (permanent wilt). The resulting saturation fraction is scaled to the soil’s FC-PWP range: Current VWC = PWP + fraction x (FC – PWP). Output is displayed to one decimal place.
Step 4: Calculate Irrigation Depth. Irrigation (inches) = (FC – Current VWC) / 100 x Root Zone Depth (inches). This formula assumes perfect application efficiency. Real-world gross application depth must be divided by the system’s distribution uniformity coefficient.
Step 5: Determine Status Zone. Three thresholds are evaluated in order: (1) Current VWC at or below PWP triggers a CRITICAL alert. (2) Current VWC below PWP + (AWC x 0.3) triggers a WARNING. (3) Current VWC at or above FC x 0.9 displays OPTIMAL. All other values display ADEQUATE.
Assumptions and Limits
- FC and PWP values are USDA textural class midpoint averages. Soils with high organic matter content may hold 2 to 5 additional percentage points of water at field capacity compared to the mineral lookup values used here.
- The kPa-to-VWC conversion uses a simplified piecewise linear model. Actual soil moisture characteristic curves are nonlinear and vary by compaction level, aggregate stability, and organic content. For precision agronomy, soil-specific desorption curves should be used.
- The irrigation depth calculation assumes the soil column is homogeneous from surface to root zone depth. Stratified profiles, restrictive hardpans, or coarse-textured subsoils beneath fine-textured surface layers will alter actual water movement and distribution.
- The tool does not account for evapotranspiration occurring during or after irrigation. For scheduling purposes, ET demand should be added to the refill target, particularly in high-VPD conditions.
- Root zone depth input is user-defined. Errors in this estimate produce proportional errors in the irrigation depth output. A 50% overestimate of root depth results in a 50% over-application.
- The 1500 kPa permanent wilting point threshold is a convention for mesophytic agricultural and horticultural crops. Drought-adapted species, CAM plants, native grasses, and many xerophytes can extract water at tensions substantially above 1500 kPa without permanent damage.
- The stress trigger at PWP + 30% AWC is a conservative general-purpose threshold. Specific crops, particularly shallow-rooted annual vegetables during flowering and fruit set, may require irrigation triggers at 20% AWC depletion or less.
Standards, Safety Checks, and Secret Sauce Warnings
The fluid mechanics underlying the permanent wilting point are not widely explained in irrigation guides, and that gap creates recurring preventable losses.
Critical Warnings
- Once VWC drops to or below the PWP threshold for your soil type, the remaining water is held in pore throats smaller than 0.2 micrometers at 1500 kPa. Root cells cannot generate enough osmotic gradient to extract it. Applying water at this stage may halt further decline but will not restore turgor in cells that have already undergone plasmolysis. Sensitive crops during critical growth stages may show permanent yield reduction even after full rehydration.
- Standard commercial tensiometers cavitate (lose vacuum) at approximately 80 to 100 kPa, long before the 1500 kPa wilting point. If your tensiometer shows 80 kPa and the gauge is no longer responding to soil changes, the instrument has failed before reaching the crisis zone. Use a VWC sensor or pressure plate for drier soils, and pair your irrigation scheduling with an evapotranspiration calculator to anticipate depletion rates before they reach tensiometer limits.
- Heavy clay soils create a false confidence problem. Their high FC values (38 to 42% VWC) suggest large reserves, but their equally high PWP values (21 to 28% VWC) mean the usable band (AWC) is no larger than sandy loam. Irrigators who schedule by elapsed days rather than measured VWC can hit permanent wilt on heavy clay without noticing until canopy symptoms appear.
- Applying more water than the calculated irrigation depth does not accelerate root recovery. Once FC is reached, excess water percolates below the root zone and is lost to deep drainage. For drip-irrigated systems, verify that total application aligns with soil infiltration rate to avoid ponding, and confirm that drip run times are adjusted for emitter flow rate, not just total volume.
Minimum Standards
- Irrigate before reaching 50% AWC depletion for high-value crops and before 60 to 70% AWC depletion for established perennials and drought-tolerant species. Do not use visible wilting as the trigger point; canopy wilting at midday often lags actual root-zone moisture decline by 6 to 18 hours.
- Calibrate any VWC sensor to your specific soil type before relying on readings for irrigation scheduling. Factory calibration curves are based on mineral soils at standard bulk density. Organic soils, high-clay soils, and soils with elevated electrical conductivity require site-specific calibration.
Competitor Trap: Most field capacity guides and irrigation scheduling articles treat “watch for wilting” as a valid irrigation trigger. It is not, for high-value crops. Wilting is a hydraulic symptom that appears at the leaf level, often hours after the root zone has already crossed the permanent wilting point threshold at depth. By the time a landscape professional or grower observes leaf droop, the VWC in the fine-textured subsoil at 12 to 24 inches may have been below PWP since the previous morning. This tool calculates and warns against that threshold proactively, before it becomes visible.
Common Mistakes and Fixes
Mistake: Using Soil Type from Visual Inspection Alone
Soil color, surface texture, and stickiness are not reliable classifiers. A field that appears brown and loamy from the surface may have a clay subsoil beginning at 8 inches, fundamentally changing both the water-holding behavior and the relevant FC and PWP values for a deep root zone calculation. Two different textural classes in the same calculation produce meaningfully different irrigation targets.
Fix: Run a jar shake test or use a simple ribbon test on samples taken from within the active root zone, not just the topsoil. When in doubt about the classification, choose the finer-textured option for a conservative estimate.
Mistake: Not Accounting for Application Efficiency
The irrigation depth output from this calculator is a net figure: the volume of water the root zone actually needs to reach field capacity. It does not account for evaporation from the soil surface during irrigation, drift losses from overhead systems, or non-uniform distribution across a zone. Applying the net depth directly will consistently under-water areas at the tail end of the distribution pattern. A catch-can test quantifies your system’s distribution uniformity so you can calculate the correct gross application depth.
Fix: Divide the net irrigation depth by your system’s distribution uniformity coefficient (typically 0.75 to 0.90 for well-maintained systems) to get gross application depth before programming your controller.
Mistake: Entering Total Plant Height as Root Zone Depth
A 6-foot tomato plant does not have a 72-inch root zone. Most vegetable crops concentrate the majority of their water uptake in the top 12 to 18 inches of soil, even when occasional roots extend significantly deeper. Overestimating root depth inflates the calculated irrigation volume and encourages over-application and deep percolation losses.
Fix: Use published agronomic root depth tables by crop, or physically confirm effective rooting depth by digging a small pit or using a soil probe in a representative location of the field.
Mistake: Treating Silt Loam and Loam as Interchangeable
These two textures are adjacent in the USDA triangle and are commonly confused on field observation, but they have meaningfully different water characteristics. Silt Loam holds FC at 33% VWC with a PWP at 14%, while Loam holds FC at 27% and PWP at 12%. Selecting the wrong class changes both the absolute irrigation depth and the stress threshold by a computable margin. For a 24-inch root zone, misclassifying Silt Loam as Loam understates the irrigation depth by approximately 0.72 inches and misplaces the stress trigger. Systems calibrated for precipitation rate are affected by this too; see the matched precipitation rate calculator if you are balancing multi-zone systems on the same controller.
Fix: Confirm texture from a lab particle size analysis or USDA Web Soil Survey for the field location before finalizing any scheduled irrigation program.
Mistake: Ignoring the Stress Zone Between PWP and 30% AWC Depletion
The permanent wilting point is the absolute floor, but stress responses in plants begin well above it. At 50% AWC depletion, stomatal conductance starts to decline in many annual crops. At 70% AWC depletion, photosynthesis rates are measurably reduced even if wilting is not yet visible. Scheduling irrigation exclusively to the PWP threshold is a management strategy designed for drought survival, not yield optimization.
Fix: For production crops, set the irrigation trigger at the stress threshold displayed by the tool (PWP + 30% AWC), not at the PWP boundary itself. For high-value specialty crops, consider tightening the trigger to 20% AWC depletion.
Next Steps in Your Workflow
Once you have the net irrigation depth from this calculator, the next step is converting that depth into a runtime for your specific delivery system. Application rate varies enormously between drip emitters, overhead rotors, and center pivot spans. An irrigation pump sizing calculator can confirm that your pump is delivering sufficient flow at the operating pressure required to meet the calculated application depth within your target runtime window. For large-scale field operations using mechanized systems, the hydraulic design constraints of your delivery infrastructure directly determine how quickly you can apply the computed irrigation depth.
Longer term, this calculator works best as part of a monitoring loop rather than a one-time calculation. Taking readings at consistent times, before solar heating begins, at the same sensor depth and location, and recording them against weather data gives you a depletion rate that can be cross-referenced with crop stage. Fields with drainage challenges need particular attention; tile drainage systems affect how quickly water moves through the profile after irrigation, which changes how long it takes for VWC to stabilize at or below field capacity. If subsurface drainage is active in your field, a farm tile drainage calculator helps size and schedule drainage infrastructure so it does not pull soil moisture below target thresholds prematurely in the days following irrigation.
FAQ
What is the difference between field capacity and saturation?
Saturation is the theoretical maximum water content when all pore spaces are filled, including macropores. Field capacity is reached 24 to 48 hours after saturation when gravitational drainage has largely stopped and only capillary-held water remains. Field capacity is always lower than saturation, typically by 5 to 15 percentage points depending on soil texture and structure. FC is the practical upper limit for plant-available water, not saturation.
Can I use this calculator for hydroponic or container growing media?
No. The USDA texture-based lookup values in this tool apply to mineral soils with defined particle size distributions. Peat, coir, perlite, rockwool, and blended potting media have moisture characteristic curves that differ substantially from any USDA texture class. Container media reaches field capacity at tensions well below 33 kPa, and the concept of permanent wilting point as defined by 1500 kPa does not apply in the same way to engineered substrates.
Why does my tensiometer stop responding before hitting 80 kPa?
Tensiometers maintain a vacuum in a sealed water column. When that vacuum exceeds approximately 80 to 100 kPa, air bubbles nucleate in the column (cavitation), breaking the hydraulic connection between the ceramic cup and the gauge. The instrument physically cannot measure tension above this point. Refilling the reservoir and re-seating the cap resets it, but the reading gap between 80 kPa and the 1500 kPa permanent wilting point requires alternative methods such as capacitance sensors, gypsum blocks, or pressure plates.
Is volumetric water content the same as soil moisture percentage?
Not always. Volumetric water content (VWC) is the ratio of water volume to total soil volume, expressed as a percentage or decimal. Gravimetric water content is the ratio of water mass to dry soil mass. The two are related through bulk density: VWC = gravimetric water content x bulk density. For mineral soils, the two are numerically similar but not identical. This calculator uses VWC exclusively. Confirm which your sensor outputs before entering a value.
How often should I take readings during the growing season?
Reading frequency depends on evaporative demand, crop stage, and soil texture. Coarse-textured sandy soils with shallow root zones can deplete their available water reservoir in 24 to 48 hours under high evapotranspiration conditions. Fine-textured soils with deep root zones may hold 5 to 7 days of supply. During peak demand periods such as fruit set or canopy closure, daily readings provide the minimum resolution for proactive scheduling. During establishment or low-demand periods, every 2 to 3 days is generally sufficient.
What does the 30% AWC stress trigger threshold represent?
The tool flags a warning when current VWC falls below PWP plus 30% of the AWC. This corresponds roughly to the onset of mild hydraulic stress in most mesophytic crops, where root water uptake begins to lag behind transpiration demand. The 30% figure is a general agronomic convention, not a fixed biophysical constant. Some crops and growth stages require irrigation at 20% or even 10% AWC depletion to prevent yield-reducing stress events. Treat it as an early warning, not as the emergency stop.
Conclusion
The field capacity soil moisture calculator on this page quantifies what most irrigation guides leave as intuition: the exact volume of water your root zone needs, framed against the permanent wilting point that defines the boundary between recoverable stress and irreversible damage. The core differentiator is not the arithmetic itself but the threshold logic built around it. Knowing that your current VWC is 26% means very little without knowing that your soil’s PWP is 28%, and that the difference between those two numbers represents a crop already past its recovery window.
The single most important mistake to avoid is using visible wilting as your irrigation trigger. It is a lagging indicator, not a leading one, and in fine-textured soils with high water-holding capacity it can appear hours or days after the root zone has crossed into the danger zone. Run the calculator on actual sensor data, respect the stress threshold warning the tool provides, and calibrate your application depth against your system’s verified distribution uniformity. For sites with formal drainage infrastructure, pairing soil moisture management with a pond aeration calculator helps complete the water balance picture across the full site hydrology.
Lead Data Architect
Umer Hayiat
Founder & Lead Data Architect at TheYieldGrid. I bridge the gap between complex agronomic data and practical growing, transforming verified agricultural science into accessible, mathematically precise tools and guides for serious growers.
View all tools & guides by Umer Hayiat →


