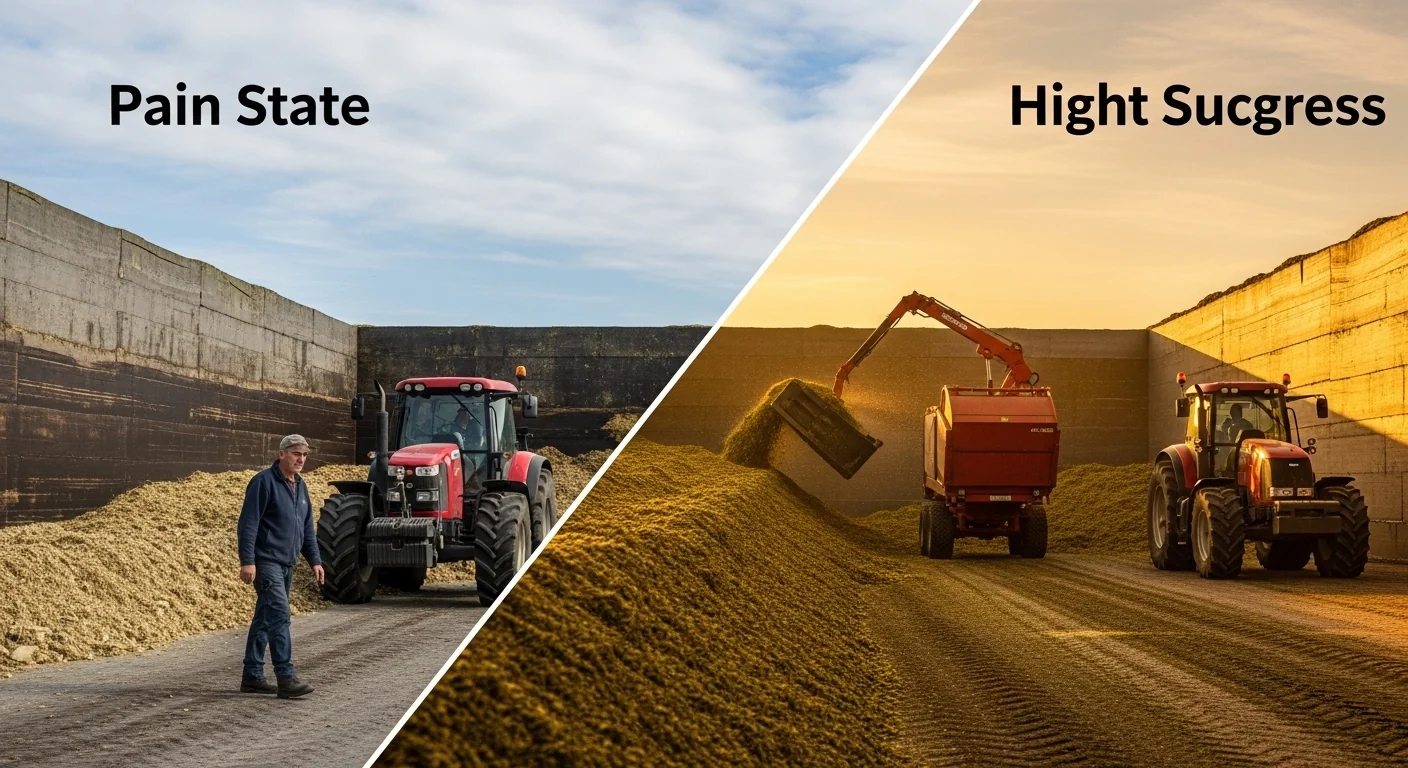
Volume alone does not tell you whether a bunker silo will produce usable feed. The number most producers get wrong is not cubic feet or tons — it is packing density. At or above 15 lbs of dry matter per cubic foot, Lactobacillus bacteria dominate the fermentation, drop pH to the 3.8 to 4.2 range, and lock the silage into stable preservation. Below that threshold, residual oxygen survives long enough for Clostridium bacteria to establish, shifting the fermentation toward butyric acid production. The result is a pile that smells like rancid vomit and that livestock will refuse. Volume math cannot catch that failure. Packing force math can.
This calculator takes your trench or bunker dimensions, crop type, target dry matter, and tractor weight, then computes estimated capacity in tons as-fed, checks whether your packing equipment meets the minimum force standard for your fill rate, and returns a traffic-light safety status tied directly to fermentation science. It does not predict forage quality, inoculant performance, or weather risk during the fill window. Those variables exist outside what dimensional and weight inputs can resolve.
After running this calculator, you will know whether your tractor is heavy enough to achieve anaerobic density at your anticipated fill rate — and if it is not, you have the number you need to decide whether to add equipment, slow the fill operation, or adjust bunker dimensions before harvest begins.
Use the Tool
| Bunker Size (ft) | Volume (ft³) | Capacity @ 15 DM | Capacity @ 18 DM |
|---|
How This Calculator Works
Step 1 — Bunker Volume: Volume = Length × Width × Height (cubic feet)
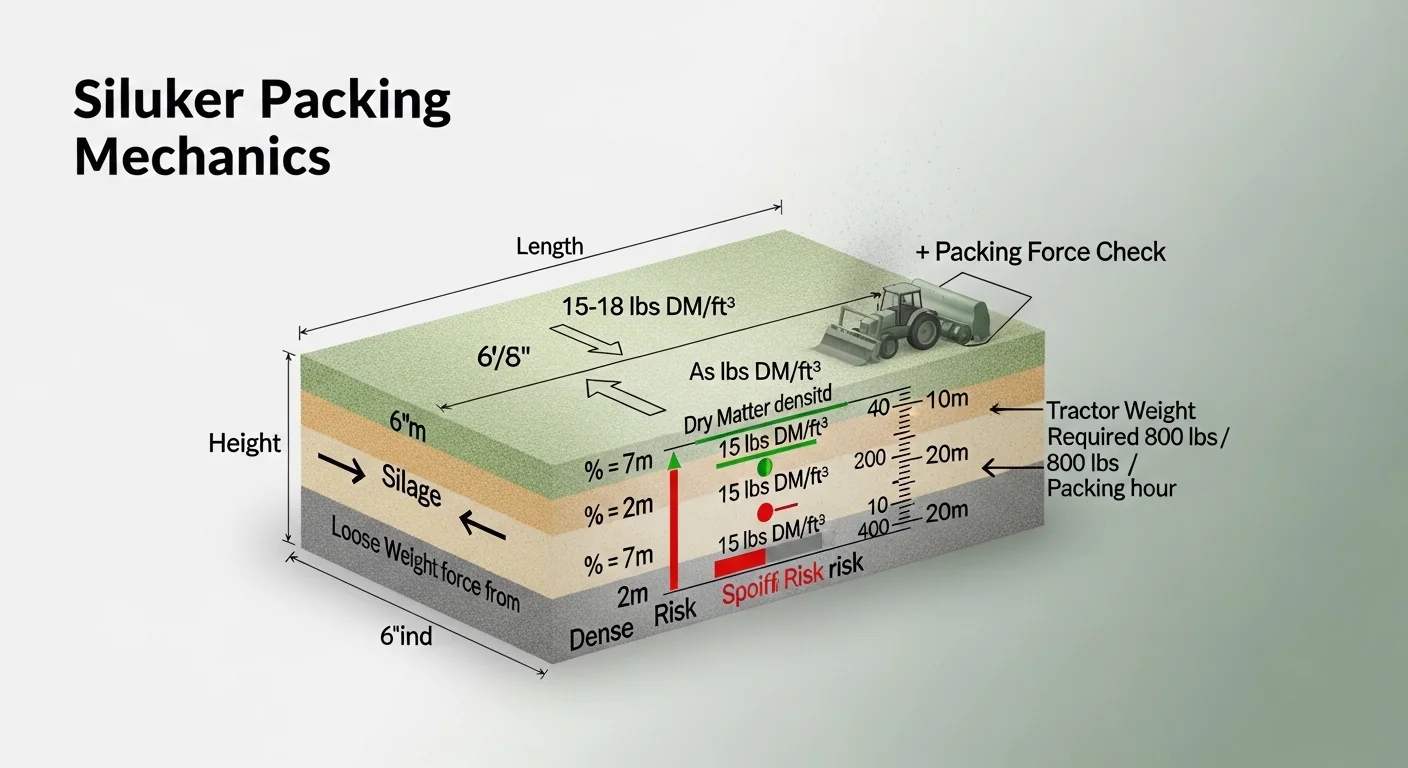
Step 2 — Target Density: Optimum packing density is 15 to 18 lbs DM/ft³. We use the midpoint (16.5) as the target for capacity estimation, then show the range.
Step 3 — As-Fed Density: As-Fed Density = DM Density ÷ (Target DM% ÷ 100). For example, at 32% DM and 16.5 lbs DM/ft³, as-fed density is 51.6 lbs/ft³.
Step 4 — Capacity in Tons: Tons = (Volume × As-Fed Density) ÷ 2000
Step 5 — Packing Force Check: The rule of thumb is the packing tractor must weigh at least 800 lbs per ton of silage delivered per hour. We estimate delivery rate based on bunker capacity and a standard 10-hour fill day to check whether your tractor is heavy enough to achieve anaerobic density.
Assumptions: Rectangular cross-section (no slope correction). Density targets are based on University of Wisconsin Extension guidelines. Corn silage typically targets 15+ lbs DM/ft³; haylage often needs 16+ due to higher fiber resistance.
Assumptions & Limits
This calculator assumes a standard rectangular bunker or trench silo with vertical walls. Drive-over piles and ag-bags require different volume calculations.
Density targets (15–18 lbs DM/ft³) are based on research from the University of Wisconsin and Kansas State University Extension programs.
Packing force estimates assume a single packing tractor. Multiple tractors can reduce the required per-unit weight.
Fermentation quality depends on more than density alone: chop length (3/4″ theoretical for corn), moisture, inoculant use, and face management after opening all affect outcomes.
Butyric acid (Clostridium) spoilage occurs when oxygen penetrates due to insufficient packing, allowing anaerobic putrefactive bacteria to dominate over beneficial Lactobacillus. A minimum of 15 lbs DM/ft³ ensures oxygen exclusion.
Dry matter range: 20%–55%. Values below 30% risk seepage; above 40% risk poor fermentation and heating.
- 5-Mil Oxygen Barrier Silage Film
- Heavy-Duty Silage Tape
- Digital Forage Moisture Tester
- Kestrel Handheld Weather Meter
- Silage Inoculant Applicator
Before entering values, have your bunker measurements ready in feet: interior length, width, and usable fill height (not the wall height — measure to the planned silage surface). Know your crop type and its target dry matter at harvest, and record the gross weight of the packing tractor from the operator’s manual or a certified scale ticket. If you plan to use rotational grazing to manage pasture recovery while the bunker cures, running that calculation alongside this one helps align your stored forage window with your field rotation schedule.
Quick Start (60 Seconds)
- Trench Length (ft): Measure the interior length of the bunker, not the concrete wall. Do not include the ramp.
- Trench Width (ft): Interior width at the base. For trapezoidal cross-sections, use the average of the top and bottom widths.
- Trench Height (ft): Your planned fill height, not the wall height. Overfilling above walls creates sealing problems — enter a realistic number.
- Crop Type: Corn silage and haylage have different minimum density targets due to fiber structure. Select the correct crop or the packing force check will use the wrong threshold.
- Target Dry Matter (%): Enter the moisture reading from a forage moisture tester at harvest, not a generic estimate. Corn silage commonly ranges from 30% to 35%; haylage from 35% to 50%.
- Tractor Weight (lbs): Use the total gross vehicle weight with ballast, not the published base weight. A tractor packing at 18,000 lbs behaves very differently from one at 26,000 lbs with wheel weights and a filled cab.
Inputs and Outputs (What Each Field Means)
| Field | Unit | What It Means | Common Mistake | Safe Entry Guidance |
|---|---|---|---|---|
| Trench Length | ft | Interior horizontal length of the bunker or trench silo | Using exterior wall measurement instead of interior fill space | 1 to 2,000 ft; measure at the silage floor level |
| Trench Width | ft | Interior width at the base; used directly in volume formula | Forgetting to account for angled walls in older structures | 1 to 500 ft; average top and bottom for tapered walls |
| Trench Height | ft | Planned fill height of the silage mass | Entering wall height instead of actual planned silage depth | 1 to 100 ft; keep at or below wall height for sealing |
| Crop Type | — | Determines minimum safe packing density threshold used in the check | Leaving at default when switching from corn to haylage mid-season | Corn silage minimum: 15 lbs DM/ft³; haylage minimum: 16 lbs DM/ft³ |
| Target Dry Matter | % | Percentage of the fresh-weight silage that is dry matter at harvest | Using a book estimate instead of a moisture meter reading | 20% to 55%; values below 30% risk seepage; above 40% risk heating |
| Tractor Weight | lbs | Gross packing tractor weight, including ballast, fluids, and operator | Using the published base weight instead of actual ballasted weight | 1,000 to 200,000 lbs; use a certified scale ticket when possible |
| Bunker Capacity (output) | tons as-fed | Estimated feed volume at mid-range packing density (16.5 lbs DM/ft³) | Treating the mid estimate as a guarantee rather than a planning target | Review the low and high range; plan procurement around the low estimate |
| Packing Density Gauge (output) | lbs DM/ft³ | Achieved or estimated density based on tractor weight and fill rate | Ignoring the gauge when it shows below the threshold marker | Must reach at least 15 lbs DM/ft³ for corn; 16 for haylage |
Worked Examples (Real Numbers)
Example 1: Small Family Farm Corn Silage Bunker
- Length: 60 ft, Width: 20 ft, Height: 8 ft
- Crop: Corn Silage
- Target Dry Matter: 32%
- Tractor Weight: 18,000 lbs
Volume: 60 x 20 x 8 = 9,600 ft³
As-fed density at mid target (16.5 / 0.32): 51.56 lbs/ft³
Capacity: (9,600 x 51.56) / 2,000 = 247 tons as-fed
Estimated delivery rate: 247 / 10 = 24.7 tons/hr
Required packing force: 24.7 x 800 = 19,760 lbs
18,000 lbs tractor is below 19,760 lbs required.
Result: CAUTION — marginal packing force. Adding 2,000 lbs of wheel weights or ballast water would meet the threshold. Slowing the fill operation reduces the required force proportionally.
Example 2: Medium Commercial Bunker, Corn Silage
- Length: 150 ft, Width: 40 ft, Height: 12 ft
- Crop: Corn Silage
- Target Dry Matter: 33%
- Tractor Weight: 45,000 lbs
Volume: 150 x 40 x 12 = 72,000 ft³
As-fed density at mid target (16.5 / 0.33): 50.0 lbs/ft³
Capacity: (72,000 x 50.0) / 2,000 = 1,800 tons as-fed
Estimated delivery rate: 1,800 / 10 = 180 tons/hr
Required packing force: 180 x 800 = 144,000 lbs
Result: SPOILAGE RISK — single tractor severely insufficient. At this scale, achieving the minimum density requires multiple heavy tractors operating simultaneously or a significantly extended fill schedule to reduce the per-hour delivery rate.
Example 3: Haylage Trench, Mid-Size Operation
- Length: 80 ft, Width: 25 ft, Height: 10 ft
- Crop: Haylage
- Target Dry Matter: 38%
- Tractor Weight: 25,000 lbs
Volume: 80 x 25 x 10 = 20,000 ft³
As-fed density at haylage mid target (17.5 / 0.38): 46.05 lbs/ft³
Capacity: (20,000 x 46.05) / 2,000 = 461 tons as-fed
Estimated delivery rate: 461 / 10 = 46.1 tons/hr
Required packing force: 46.1 x 800 = 36,880 lbs
Result: CAUTION — tractor weight is marginal for haylage. Haylage fiber resists compaction more than corn silage. Consider slowing delivery or bringing in a second packing unit for the first two-thirds of the fill when the pile is building height and packing efficiency is lowest.
Reference Table (Fast Lookup)
All values assume 35% dry matter and a 10-hour fill day. Tractor minimum is based on the rule of 800 lbs per ton per hour delivered. Capacities shown at low (15 lbs DM/ft³), mid (16.5 lbs DM/ft³), and high (18 lbs DM/ft³) density targets for corn silage.
| Bunker Dimensions (L x W x H, ft) | Volume (ft³) | Capacity @ 15 DM (tons) | Capacity @ 16.5 DM (tons) | Capacity @ 18 DM (tons) | Min. Tractor (lbs, mid density) |
|---|---|---|---|---|---|
| 60 x 20 x 8 | 9,600 | 206 | 226 | 247 | 18,080 |
| 80 x 25 x 10 | 20,000 | 429 | 471 | 514 | 37,680 |
| 100 x 30 x 10 | 30,000 | 643 | 707 | 771 | 56,560 |
| 100 x 40 x 12 | 48,000 | 1,029 | 1,131 | 1,234 | 90,480 |
| 120 x 40 x 12 | 57,600 | 1,234 | 1,357 | 1,481 | 108,571 |
| 150 x 40 x 12 | 72,000 | 1,543 | 1,697 | 1,851 | 135,771 |
| 150 x 50 x 14 | 105,000 | 2,250 | 2,475 | 2,700 | 198,000 |
| 200 x 50 x 16 | 160,000 | 3,429 | 3,771 | 4,114 | 301,714 |
How the Calculation Works (Formula + Assumptions)
Show the calculation steps
Step 1 — Bunker Volume: Volume (ft³) = Length x Width x Height. This is a simple rectangular volume. No slope correction or taper adjustment is applied.
Step 2 — As-Fed Density: The target packing density range is 15 to 18 lbs of dry matter per cubic foot. To convert to as-fed weight (which includes moisture), divide the dry matter density by the dry matter fraction: As-Fed Density = DM Density / (DM% / 100). At 32% DM and 16.5 lbs DM/ft³ target, this gives 51.56 lbs as-fed per cubic foot.
Step 3 — Tons Capacity: Tons = (Volume x As-Fed Density) / 2,000. The division by 2,000 converts pounds to short tons.
Step 4 — Packing Force Check: The standard rule (University of Wisconsin Extension) states that packing tractor weight should be at least 800 lbs per ton of silage delivered per hour. The calculator estimates the hourly delivery rate by dividing mid-range capacity by 10 (a standard 10-hour fill day assumption). Required tractor weight = (Tons / 10) x 800.
Rounding: Capacity results are rounded to the nearest whole ton. Packing force is rounded to the nearest pound. Density percentages are carried to two decimal places in the intermediate calculation.
Unit note: All dimensions must be in feet. All weights must be in pounds. Capacity outputs are in short tons (2,000 lbs), not metric tonnes.
Assumptions and Limits
- The bunker is assumed to have a rectangular cross-section. Drive-over piles, ag-bags, and tower silos require different volume formulas.
- The 10-hour fill day assumption directly affects the packing force check. Operations that fill over multiple days or very fast single-day operations should adjust their expectations accordingly.
- A single packing tractor is assumed. Two tractors operating simultaneously effectively double the available packing force and can allow lighter individual units to meet the threshold.
- Density targets (15 to 18 lbs DM/ft³) are derived from University of Wisconsin and Kansas State University Extension research. Specific field conditions, chop length, and crop maturity will affect actual achieved density.
- Dry matter below 30% carries seepage risk that affects nutrient recovery but is not modeled as a capacity change in this calculator.
- The calculator does not account for silage taper, settling over time, or feedout losses. Actual recoverable tons will be lower than calculated capacity due to surface spoilage at the silage face and edges.
- Haylage density minimums (16 lbs DM/ft³) are set higher than corn silage (15 lbs DM/ft³) because legume and grass fiber resists compaction structurally, requiring greater applied force to achieve the same oxygen exclusion.
Standards, Safety Checks, and “Secret Sauce” Warnings
The fermentation biology of silage is not forgiving of approximation. These are the deterministic thresholds that separate preserved feed from spoiled biomass.
Critical Warnings
- If packing density falls below 15 lbs DM/ft³ for corn silage or 16 lbs DM/ft³ for haylage, residual oxygen allows Clostridium bacteria to outcompete Lactobacillus. The Clostridium pathway produces butyric acid instead of lactic acid, raising pH and generating the characteristic rancid odor that causes feed refusal. A single under-packed fill can destroy an entire season’s forage investment.
- Dry matter below 30% at ensiling creates effluent (silage juice) that leaches water-soluble nutrients from the pile and poses a serious water quality risk. Most jurisdictions classify silage effluent as an agricultural pollutant subject to runoff regulations. The winter cattle feed calculator can help you model how lost nutrients from a compromised pile affect your supplemental feed budget through the cold months.
Minimum Standards
- Corn silage: 15 lbs DM/ft³ absolute minimum; 16.5 lbs DM/ft³ practical target for extended storage or summer feedout.
- Haylage: 16 lbs DM/ft³ minimum; 17 to 19 lbs DM/ft³ recommended for high-moisture material below 35% DM.
- Oxygen barrier film: minimum 5-mil thickness on the top and sides; overlap seams by at least 12 inches and seal with approved silage tape before any surface weight is applied.
- Packing tractor: 800 lbs per ton per hour delivered, per UW-Madison Extension recommendation. This is a minimum, not an optimum.
The Competitor Trap: Most silage volume calculators on the web output a single “tons in your bunker” number and stop there. That number has no safety meaning without the packing force check. A producer can have a correctly sized bunker and the right tonnage estimate and still lose the entire pile because the tractor was 30% too light for their fill rate. Capacity math without density math is like calculating fuel tank size without checking whether the engine runs on diesel or gasoline — the number is real, but it does not tell you whether the system will work.
Operations that also track their pasture stocking rate alongside stored forage capacity will have a clearer picture of whether their bunker tonnage is actually sufficient for their herd during the grazing gap — rather than discovering a shortfall mid-winter.
Common Mistakes and Fixes
Mistake: Using Wall Height Instead of Fill Height
Bunker walls are typically built taller than the planned silage surface to allow for the mound that forms during filling. Entering the wall height inflates the volume by 15% to 40% depending on structure, producing a capacity estimate that cannot physically be achieved without compromising sealing. Measure the height you plan to actually fill to, not the wall height stamped on the construction drawing.
Fix: Mark a reference point on the interior wall at your target fill height before harvest and measure from floor to mark.
Mistake: Ignoring the Tractor Ballast Difference
Published tractor specifications list base weight, which can be several thousand pounds lighter than the actual operating weight with fluid ballast, wheel weights, a loaded cab, and a full fuel tank. A tractor listed at 22,000 lbs base may weigh 28,000 to 30,000 lbs when fully ballasted for silage packing — a difference that can move a borderline packing check from CAUTION to SAFE. The livestock trailer weight calculator illustrates the same ballasting principle for transport applications.
Fix: Use a certified weigh scale ticket or add documented ballast weights to the base spec before entering the value.
Mistake: Treating the Mid-Range Estimate as a Guaranteed Capacity
The capacity output at 16.5 lbs DM/ft³ is a planning target, not a contractual tonnage. Achieved density varies with chop length, tractor speed, layer thickness, surface moisture, and ambient temperature during filling. Real-world density in commercial bunkers commonly ranges from 13 to 20 lbs DM/ft³ depending on management.
Fix: Size forage contracts and feed purchase decisions against the low estimate (15 lbs DM/ft³), not the mid or high estimate.
Mistake: Entering an Average Dry Matter That Differs from Harvest-Day Reality
Dry matter in corn silage shifts by several percentage points over as little as 48 hours depending on drydown rate and weather. Using a target from planting records or last year’s test rather than a same-day moisture meter reading can throw off the density calculation enough to flip the packing check from safe to marginal. A digital forage moisture tester takes less than two minutes per sample.
Fix: Take at least three grab samples from the chopped stream at different points during the fill day and average them. Re-run the calculator if the result differs from your entry by more than 3 percentage points.
Mistake: Assuming One Tractor Pass Per Layer Is Sufficient
The 800 lbs per ton per hour rule assumes continuous, overlapping passes across the entire bunker face. A single slow pass along the center lane and turning at the ends is not sufficient to achieve uniform density — the edges and corners of the bunker are chronically under-packed and are the most common site of Clostridial spoilage pockets.
Fix: Run a consistent figure-eight or back-and-forth pattern that reaches within 2 feet of the side walls on every pass, and pack each layer before adding the next.
Next Steps in Your Workflow
Once you have confirmed your bunker capacity and verified the packing force check passes, the next calculation is feedout rate. Knowing how many tons your herd consumes per day against the stored total tells you exactly when the bunker needs to be open and whether you have the inventory margin to weather a late-season forage shortage. The cattle water requirement calculator can run alongside feedout planning because water intake is tightly coupled to dry matter intake — a bunker calculation without a water infrastructure check leaves a gap in your winter management plan.
For operations where silage is the primary cost driver of the ration, running the numbers through a feed cost calculator after you have confirmed tonnage and density will give you a cost-per-ton basis that can be compared directly against custom harvesting bids, commercial silage prices, or the cost of correcting an under-packed pile after the fact. The economic gap between a safe pile and a spoiled one is often large enough to justify additional packing equipment or a slower fill schedule.
FAQ
What is the minimum packing density for corn silage?
The research consensus, most commonly cited from University of Wisconsin Extension, sets the minimum at 15 lbs of dry matter per cubic foot for corn silage. Below this level, residual oxygen persists long enough to allow Clostridial fermentation and butyric acid production. A practical target for most operations is 16 to 17 lbs DM per cubic foot.
How do I know if my tractor is heavy enough to pack a bunker?
The standard rule is 800 lbs of tractor weight for every ton of silage delivered per hour. Divide your estimated bunker capacity by the number of hours you plan to fill over. Multiply that hourly rate by 800 to get the minimum tractor weight. This calculator performs that check automatically once all inputs are entered.
What causes butyric acid in silage?
Butyric acid is produced by Clostridium bacteria, which thrive in anaerobic conditions with high pH. In silage, this happens when packing density is insufficient, allowing oxygen to persist and preventing Lactobacillus from dropping pH quickly enough. High moisture at ensiling (below 30% DM) also favors Clostridial activity regardless of packing density.
Can I use this calculator for drive-over piles or ag-bags?
No. The volume formula assumes a rectangular cross-section with flat walls and a flat floor, which applies to bunker and trench silos. Drive-over piles have a triangular or trapezoidal cross-section that requires a different formula. Ag-bag capacity is determined by bag diameter and fill length, not open-air dimensions.
What is the difference between corn silage and haylage for this calculator?
The crop type selection changes the minimum packing density threshold applied in the safety check. Haylage (grass and legume silage) uses a minimum of 16 lbs DM per cubic foot rather than 15, because grass and legume fiber is structurally stiffer than corn silage and resists compaction, requiring greater applied force to achieve the same oxygen exclusion. The capacity formula is otherwise identical.
Why does dry matter percentage affect the capacity estimate?
Packing density is measured in pounds of dry matter per cubic foot, but silage is weighed as-fed (including water). At lower dry matter, more of each cubic foot is water weight. Converting from a dry matter density target to an as-fed weight requires dividing by the dry matter fraction, which changes the tons-per-cubic-foot relationship significantly across the 20% to 55% input range.
Conclusion
A silage bunker capacity calculator that only outputs volume is answering the wrong question. The number a producer actually needs before harvest is whether the packing operation can achieve anaerobic density across the full pile at the planned fill rate — because that is the variable that determines whether the pile becomes feed or becomes a writeoff. This calculator connects the dimensional math to the fermentation biology, making the safety check part of the planning process rather than an afterthought.
The single most consistent failure mode in bunker silage is the under-ballasted tractor that looks adequate on paper but falls short on the scale. Run the packing force check before harvest, not after. Producers managing high-producing dairy herds who want to carry this precision into the ration side of the operation may also find value in the dairy cow calcium calculator, which addresses another mineral-balance decision that silage quality directly affects.
Lead Data Architect
Umer Hayiat
Founder & Lead Data Architect at TheYieldGrid. I bridge the gap between complex agronomic data and practical growing, transforming verified agricultural science into accessible, mathematically precise tools and guides for serious growers.
View all tools & guides by Umer Hayiat →