Most irrigation schedules are set by guesswork or copied from a neighbor’s controller. The actual output of a sprinkler zone depends on head type, spacing, water pressure, and pipe diameter — none of which match a published manufacturer spec once the system is installed. The only way to get an accurate runtime is to measure what lands on the turf, then divide your target water depth by that measured rate.
This sprinkler run time calculator takes three inputs — the target water depth in inches, the output you measured during a 15-minute tuna can (catch-can) test, and how many days per week you water — and returns the exact minutes to run each zone per session. It also flags when your runtime is long enough to require a cycle-and-soak schedule, and warns when your output rate falls outside the range where single-session watering is practical. What it does not do: account for rainfall, evapotranspiration deficits, soil type, or slope. It solves for runtime based on measured output, nothing more.
After running the calculator, you will know exactly how many minutes to program per zone and whether to split that runtime into two or three cycles to avoid surface runoff.
Use the Tool
| 15-min Output | Hourly Rate | Mins Needed (1″) | 3×/wk per session |
|---|
How This Calculator Works
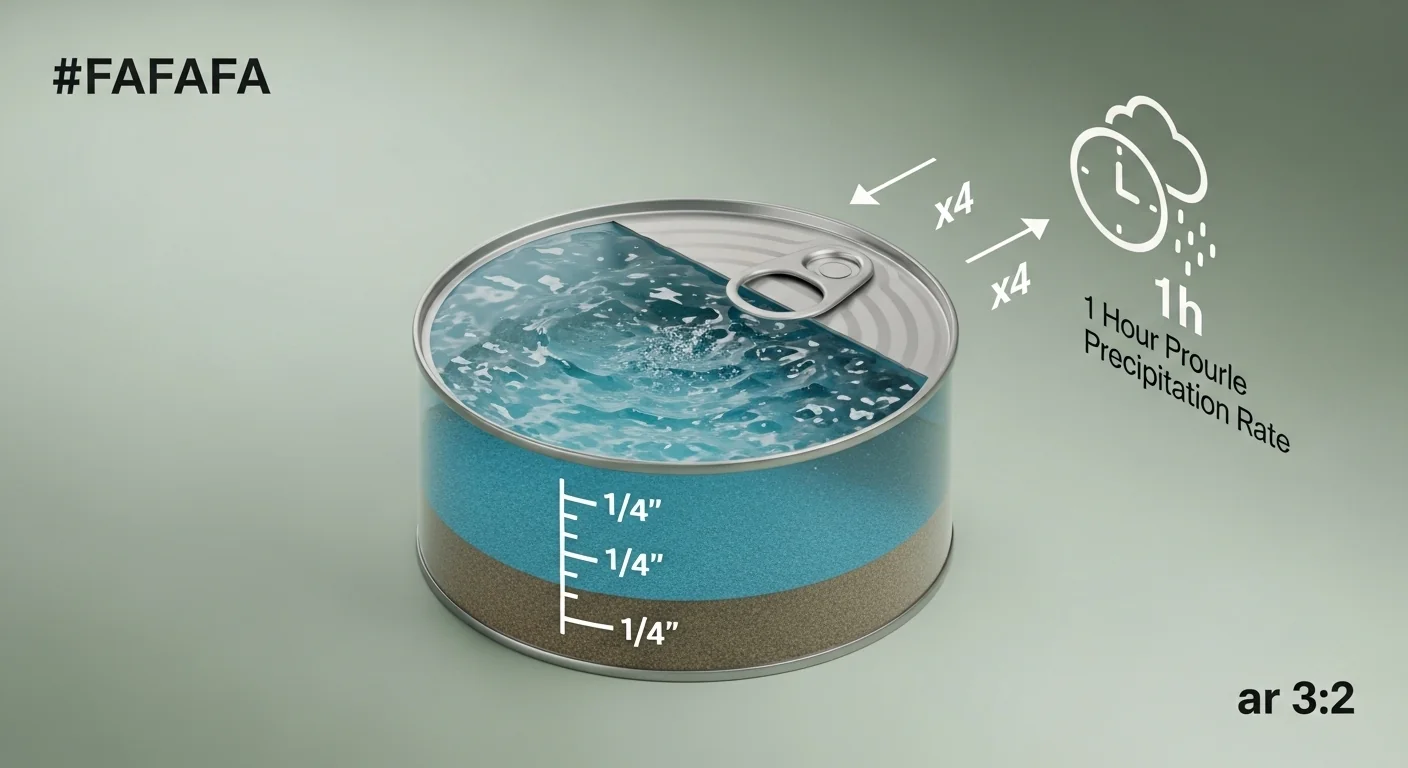
Hourly Rate (in/hr) = Test Output (in) × 4
Example: 0.25 in collected in 15 min → 0.25 × 4 = 1.00 in/hr
Mins Needed = (Target ÷ Hourly Rate) × 60
Example: (1.00 ÷ 1.00) × 60 = 60 min total needed
Per Session (min) = Mins Needed ÷ Days Per Week
Example: 60 ÷ 3 days = 20 min per session
Assumptions & Limits
- Assumes uniform sprinkler distribution — actual coverage may vary by head type and overlap.
- The 15-minute tuna-can test is the industry-standard catch-can method; results depend on accurate placement within the spray zone.
- Formula assumes target is applied each watering session equally; if watering days are uneven, results will differ.
- Does not account for rainfall, evapotranspiration (ET), soil type, or slope — adjust for local conditions.
- Cycle & Soak recommendation applies when runtime exceeds 30 minutes per session; minimum soak period of 30 minutes between cycles is assumed.
- Valid input ranges: Target Water 0.1–4 in; Test Output 0.01–2 in; Frequency 1–7 days/week.
- Results are guidelines only. Always verify with local water authority recommendations.
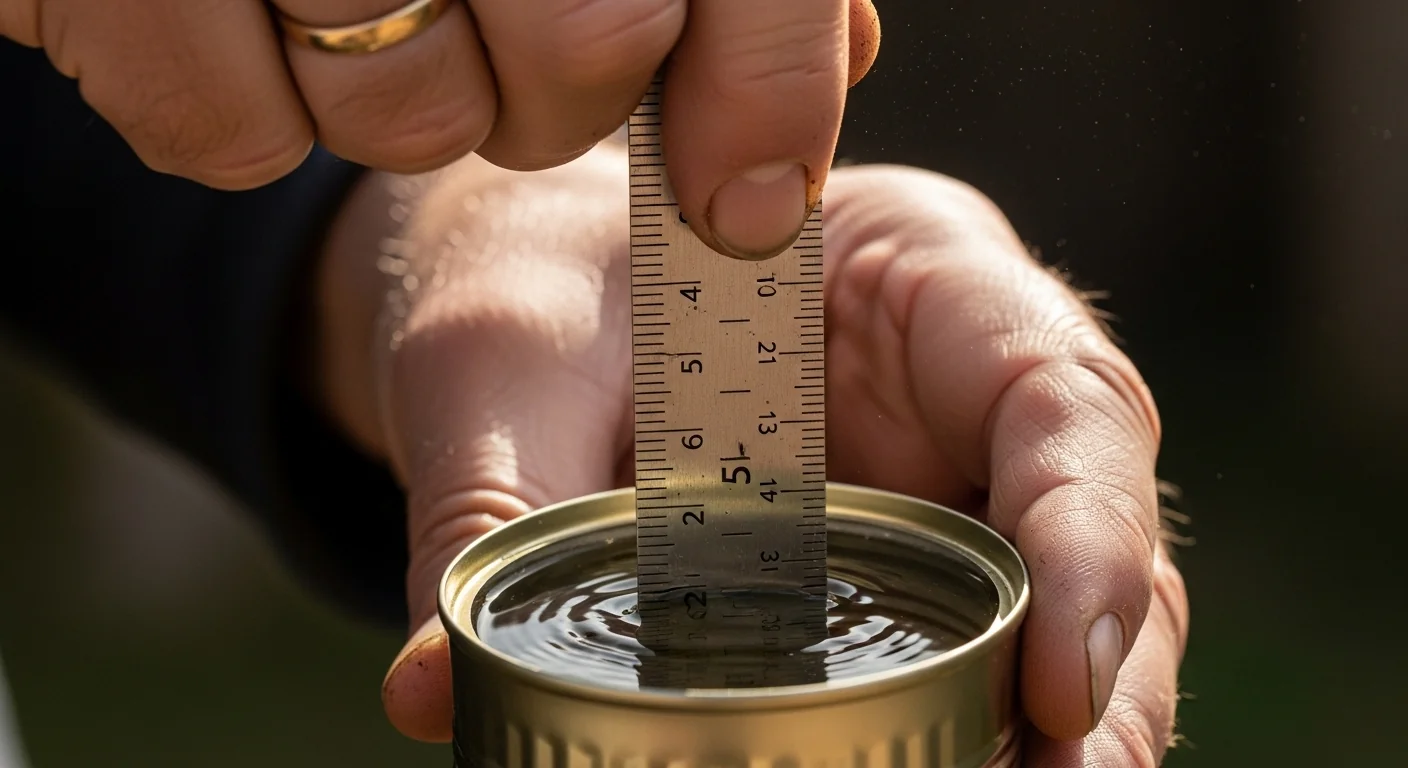
Before entering values, have your tuna can (or any straight-sided container) and a ruler ready. Run a 15-minute test with your system at normal operating pressure and measure the water depth in the can. Also decide on your weekly watering frequency before calculating — changing frequency after the fact changes your per-session time proportionally. For information on comparing output uniformity across multiple catch-can positions, the irrigation catch-can test calculator walks through a full distribution uniformity analysis.
Quick Start (60 Seconds)
- Target Water (inches): Use 1.0 inch for cool-season turf in moderate climates. Enter the full weekly target if you water once per week, or the same value if you split across multiple days — the calculator divides it for you. Valid range: 0.1 to 4 inches.
- Test Output (inches in 15 min): Place a tuna can (or any container with vertical sides) inside the spray zone — not at the edge or outside it. Run the zone for exactly 15 minutes, then measure the depth with a ruler. A typical residential rotary head delivers 0.15 to 0.35 inches in 15 minutes. Fixed spray heads often land between 0.25 and 0.60 inches.
- Frequency (days per week): Enter whole numbers only, 1 through 7. Most turf benefits from 2 to 4 sessions per week rather than daily shallow watering. Avoid entering 0 — the field requires at least 1 watering day.
- Common unit mistake: Do not convert the 15-minute catch-can reading to an hourly rate before entering it. Enter the raw 15-minute measurement; the calculator scales it internally.
- Read all three outputs: Check the per-session runtime AND the total weekly minutes. If the weekly total exceeds 120 minutes, verify your tuna can placement and re-run the test before programming your controller.
Inputs and Outputs (What Each Field Means)
| Field | Unit | What It Represents | Common Mistake | Safe Entry Guidance |
|---|---|---|---|---|
| Target Water | inches | The total water depth you want applied per watering session. Standard turfgrass target is roughly 1 inch per week total. | Entering the full weekly target but also watering 5+ days/week, which over-applies water. | 0.1 to 4 inches. For most lawns, 0.5 to 1.5 inches per session is reasonable. |
| Test Output (15 min) | inches | Water depth collected in a tuna can placed in the spray zone during a 15-minute test run. | Placing the can outside the main spray pattern or on a slope where water drains before measuring. | 0.01 to 2 inches. Values below 0.05 may indicate clogged heads or very low pressure. |
| Watering Frequency | days per week | How many individual watering sessions occur each week. | Setting frequency to 7 days to “simplify” the schedule, which promotes shallow root systems. | 1 to 7 whole days. Most turf applications use 2 to 4 days per week. |
| Hourly Output Rate (output) | in/hr | The sprinkler’s precipitation rate scaled from the 15-minute test to a full hour. | Assuming this matches the manufacturer’s listed precipitation rate — it rarely does after installation. | Healthy residential systems typically fall between 0.4 and 2.0 in/hr. Below 0.2 suggests a problem. |
| Per-Session Runtime (output) | minutes | How long to run the zone each watering day to hit your target depth. | Programming this value directly without accounting for cycle-and-soak when the runtime exceeds 30 minutes. | If this value exceeds 30 minutes, split into 2 to 3 shorter cycles with 30-minute soak intervals. |
| Total Weekly Minutes (output) | minutes | Total zone runtime per week: per-session runtime multiplied by watering frequency. | Ignoring this figure and focusing only on the per-session time, missing systematic over-watering. | Values above 120 minutes per week are unusual for most residential turf — double-check inputs. |
Worked Examples (Real Numbers)
Scenario 1: Rotary Heads on a Typical Suburban Lawn
- Target water depth: 1.0 inch
- 15-minute tuna can reading: 0.25 inches
- Watering frequency: 3 days per week
Calculation:
Hourly rate = 0.25 x 4 = 1.00 in/hr
Total minutes needed = (1.0 / 1.00) x 60 = 60 minutes
Per-session runtime = 60 / 3 = 20 minutes
Result: Run each zone for 20 minutes, three days per week. Total weekly zone runtime is 60 minutes. No cycle-and-soak is required because 20 minutes falls well below the 30-minute threshold.
Scenario 2: High-Output Fixed Spray Heads, Twice Weekly
- Target water depth: 1.0 inch
- 15-minute tuna can reading: 0.40 inches
- Watering frequency: 2 days per week
Calculation:
Hourly rate = 0.40 x 4 = 1.60 in/hr
Total minutes needed = (1.0 / 1.60) x 60 = 37.5 minutes
Per-session runtime = 37.5 / 2 = 18.75 minutes (round to 19 minutes)
Result: Run each zone for approximately 19 minutes, twice per week. Total weekly zone runtime is 37.5 minutes. The high output rate keeps the per-session time short enough to avoid runoff concerns on most soil types.
Scenario 3: Low-Output Rotors on Drought-Stressed Turf, Once Weekly
- Target water depth: 1.5 inches
- 15-minute tuna can reading: 0.15 inches
- Watering frequency: 1 day per week
Calculation:
Hourly rate = 0.15 x 4 = 0.60 in/hr
Total minutes needed = (1.5 / 0.60) x 60 = 150 minutes
Per-session runtime = 150 / 1 = 150 minutes
Result: A 150-minute single session is not practical — apply the cycle-and-soak method: three 50-minute cycles with 30-minute soak periods between each. Total active run time per week remains 150 minutes but is split across a 4-hour window to allow soil absorption between cycles.
Reference Table (Fast Lookup)
All values below assume a 1.0-inch target water depth. The “3x/wk Per Session” column is a derived output showing per-session runtime when watering 3 days per week. Entries marked with an asterisk (*) exceed the 30-minute single-cycle threshold and require a cycle-and-soak schedule.
| 15-Min Output (in) | Hourly Rate (in/hr) | Mins for 0.5″ Target | Mins for 1.0″ Target | Mins for 1.5″ Target | 3x/wk Per Session (1.0″ target) |
|---|---|---|---|---|---|
| 0.10 | 0.40 | 75.0 * | 150.0 * | 225.0 * | 50.0 * |
| 0.15 | 0.60 | 50.0 * | 100.0 * | 150.0 * | 33.3 * |
| 0.20 | 0.80 | 37.5 * | 75.0 * | 112.5 * | 25.0 |
| 0.25 | 1.00 | 30.0 | 60.0 * | 90.0 * | 20.0 |
| 0.30 | 1.20 | 25.0 | 50.0 * | 75.0 * | 16.7 |
| 0.35 | 1.40 | 21.4 | 42.9 * | 64.3 * | 14.3 |
| 0.40 | 1.60 | 18.75 | 37.5 * | 56.25 * | 12.5 |
| 0.50 | 2.00 | 15.0 | 30.0 | 45.0 * | 10.0 |
| 0.75 | 3.00 | 10.0 | 20.0 | 30.0 | 6.7 |
How the Calculation Works (Formula + Assumptions)

Show the calculation steps
Step 1 — Scale the 15-minute catch-can reading to an hourly rate:
The tuna can test captures output over 15 minutes, which is one-quarter of an hour. Multiplying by 4 converts it to an hourly precipitation rate in inches per hour:
Hourly Rate (in/hr) = 15-Minute Output (in) x 4
Step 2 — Determine total minutes required to reach the target depth at that rate:
Divide the target water depth by the hourly rate to get the fraction of an hour needed, then multiply by 60 to convert to minutes:
Total Minutes Needed = (Target Depth / Hourly Rate) x 60
Step 3 — Divide across the number of watering days to get a per-session runtime:
Per-Session Runtime (min) = Total Minutes Needed / Days Per Week
Rounding rule: All outputs are rounded to one decimal place. When programming a controller, round up to the nearest whole minute to avoid under-applying water.
Unit chain summary:
inches (15-min output) x 4 = inches/hour — divides into inches (target) — multiplied by 60 = minutes — divided by days = minutes per session.
Assumptions and Limits
- The tuna can reading assumes uniform output across the zone. A single can in a poor-coverage spot will skew the entire calculation. Multiple can placements averaged together produce more reliable inputs.
- The formula assumes every watering day receives exactly the same runtime. Mixed schedules (e.g., different runtimes Monday versus Thursday) require separate calculations per day.
- Rainfall is not subtracted. The calculator has no rain-sensor or ET input. On weeks with significant rainfall, reduce the calculated runtime or skip sessions entirely.
- Soil infiltration rate is not considered. Clay soils absorb water at 0.1 to 0.5 in/hr; sandy soils at 1.0 to 3.0 in/hr. Runtimes that exceed soil infiltration capacity cause runoff regardless of the calculated value.
- Pressure variation across a zone is not modeled. A zone with a 10-psi drop between the closest and farthest head can produce output rates that differ significantly from head to head.
- The cycle-and-soak threshold of 30 minutes is a conservative general guideline. Established turf on sandy loam may tolerate 45 minutes; compacted clay may require cycles shorter than 20 minutes.
- Maximum valid inputs are 4 inches for target depth and 2 inches for 15-minute output. Inputs outside these ranges are rejected by the calculator as likely measurement errors.
Standards, Safety Checks, and “Secret Sauce” Warnings
Critical Warnings
- Do not skip cycle-and-soak when runtime exceeds 30 minutes. Running a single long zone session on any but the sandiest soils causes water to pool and run off before it can penetrate past the thatch layer. The calculation is correct; the application method is the failure point. Split runtimes above 30 minutes into two to three cycles with at least 30 minutes between each to allow infiltration.
- A tuna can placed outside the main spray arc invalidates the test. The catch-can must sit within the area receiving full-pattern coverage — not near a head where output is highest and not at the zone boundary where overlap tapers off. An incorrect catch-can reading flows through the entire formula and produces a wrong runtime.
- Hourly output rates above 2.0 in/hr almost certainly cause runoff on standard turf. If the calculator returns an hourly rate above 2.0 in/hr, verify the catch-can position and measurement before programming the controller. High-output fixed spray heads on compacted soil are a common source of this condition. Comparing your zone output against your soil’s capacity is straightforward with the soil infiltration rate calculator.
- A very low output rate (below 0.2 in/hr) warrants a system inspection before scheduling. Low-rate readings often indicate clogged nozzles, insufficient water pressure, or broken heads rather than a correctly functioning low-output system. Running a long session on a poorly functioning zone wastes water without meeting the target depth.
Minimum Standards
- Industry practice targets 1.0 inch of total water per week for cool-season turfgrass in most temperate climates during the growing season. This figure increases during heat events and decreases during cooler or cloudy periods.
- Watering frequency of 2 to 4 days per week is widely preferred over daily shallow applications. Less frequent, deeper watering sessions promote deeper root development and reduce disease pressure.
- Any zone with a distribution uniformity below roughly 0.65 will require runtime adjustments that a single catch-can value cannot capture. Check zone uniformity with a multi-can test before relying on this calculator for precise programming. The matched precipitation rate calculator helps diagnose mixed-head zones where uniformity problems are common.
Competitor Trap: Many online sprinkler calculators ask for head type and manufacturer model, then return a “typical” precipitation rate from a spec sheet. That approach ignores pressure loss in the supply line, nozzle wear, head spacing, and installation variations — all of which change actual output significantly. A spec-sheet rate of 1.5 in/hr can easily measure at 0.8 in/hr in the field. Using the tuna can reading as the direct input eliminates all of this model error and grounds the calculation in what the system actually delivers.
Common Mistakes and Fixes
Mistake: Using the Manufacturer’s Precipitation Rate Instead of a Measured Value
Spec-sheet precipitation rates assume optimal pressure, full-radius arc, and correct head spacing — conditions that rarely match an installed residential zone. A zone running at lower-than-rated pressure will deliver less water per minute than the label suggests, causing chronic under-watering even when the schedule looks correct on paper. Run a 15-minute tuna can test and enter that reading. It takes five minutes and eliminates the most common source of runtime error.
Mistake: Running a Single Long Session Instead of Cycling
A calculator output of 60 minutes does not mean you should run the zone continuously for 60 minutes. On soils with any clay content, water will begin sheeting across the surface well before a 60-minute session ends, especially on slopes. The water leaving the property is not reaching the root zone. Split the session into two 30-minute cycles with a 30-minute rest between them — the total water applied is identical, but absorption improves significantly.
Mistake: Placing the Catch-Can at the Edge of the Zone
Zone boundaries receive lower output than the center of the pattern because sprinkler head design relies on overlapping arcs for uniform coverage. A can placed at the zone edge captures less water than a can placed in the center of the spray arc, producing a falsely low output reading. That low reading then drives a calculated runtime that is too long. Place the can in the area that receives full, overlapping coverage from two adjacent heads. If the zone mixes rotor and fixed spray heads, run separate tuna can tests for each head type before settling on a single zone runtime.
Mistake: Ignoring Weekly Total Runtime When Setting Frequency
Increasing watering frequency from 3 to 6 days per week cuts the per-session runtime in half, which looks more manageable on the controller display. The weekly total water applied, however, stays the same — unless you also reduce the target depth. High-frequency shallow watering keeps the upper soil layer wet, encouraging roots to stay near the surface and increasing vulnerability to drought stress and fungal disease. Set frequency based on agronomic need, not scheduling convenience.
Mistake: Not Adjusting for Seasonal ET Changes
A runtime that is correct in April may under-water significantly by July when evapotranspiration rates double in many climates. The calculator is a point-in-time tool — it does not model seasonal variation. Re-run the calculation or pair the output with an evapotranspiration calculator to adjust target water depth as the season changes. Leaving April runtimes unchanged through August is one of the most common causes of turf stress in summer.
Next Steps in Your Workflow
Once you have your per-session runtime, program it into the controller for each zone individually. Zones with different head types — rotors versus fixed spray heads — almost always have different output rates and require separate calculations. Do not apply a single runtime to all zones unless every zone passed the same tuna can test with similar results. If any zone needs a pump to maintain pressure, check that the pump is properly sized before relying on a runtime calculated at design pressure — the irrigation pump sizing calculator can help verify this.
After programming, run the system and observe each zone for the first few sessions. Pooling water and surface runoff signal that a cycle-and-soak schedule is needed even if the calculator did not flag the threshold. Slow green-up in dry patches signals either low distribution uniformity or a head problem in that area. Check flow rates through the supply line if runtimes seem consistently ineffective — the hose flow rate calculator is a useful starting point for diagnosing supply-side constraints.
FAQ
What is the tuna can test for sprinklers?
The tuna can test is a catch-can measurement method where you place a straight-sided container (a standard tuna can works because its consistent height makes measurement easy) inside an active sprinkler zone, run the zone for exactly 15 minutes, and measure the collected water depth. That reading directly represents the system’s actual precipitation rate without relying on manufacturer specifications or estimated pressure values.
How long should I run sprinklers per zone?
Runtime depends on your sprinkler’s measured output rate and your target water depth. There is no universal answer — a zone delivering 0.25 inches in 15 minutes needs 60 minutes to apply 1 inch of water, while a zone delivering 0.50 inches in 15 minutes needs only 30 minutes for the same target. Use the measured tuna can output, not head type or manufacturer data, to calculate zone-specific runtimes.
What is cycle and soak in irrigation?
Cycle and soak splits a long zone runtime into two or three shorter runs separated by rest periods of 20 to 30 minutes. During the rest period, water that has already been applied soaks deeper into the soil profile. This prevents surface runoff caused by applying water faster than the soil can absorb it, which is a common problem with clay soils or compacted lawns. It does not change the total amount of water applied per session.
How do I know if my sprinkler output rate is too low?
If the tuna can test returns less than 0.05 inches in 15 minutes (equivalent to under 0.20 in/hr), the output rate is unusually low for a functioning residential head. Common causes include clogged nozzles from mineral buildup or debris, water pressure below the head’s operating range, a partially closed zone valve, or a broken rotor that is no longer turning. Inspect the zone physically before calculating a schedule based on a very low reading.
Should I water every day?
Daily watering is generally counterproductive for established turf. Shallow, frequent sessions keep moisture in the top inch of soil, which is where roots follow water. Over several weeks, root systems remain near the surface and become vulnerable to heat stress and drought. Watering two to four times per week at a longer per-session runtime encourages roots to follow moisture deeper into the soil profile, which improves drought resilience and overall turf health.
Does rain count toward my sprinkler target?
Yes. Rainfall applies water the same way a sprinkler does, and it should be subtracted from your weekly target before calculating runtimes. A rainfall event depositing half an inch means you need only half an inch from irrigation that week. Rain sensors and smart controllers automate this adjustment. Without them, monitor weekly rainfall and skip or shorten irrigation sessions after significant rain events to avoid over-watering.
Conclusion
The core value of this calculator is that it replaces spec-sheet assumptions with a measurement taken from the actual system under real operating conditions. A tuna can reading takes five minutes and eliminates the largest source of error in most irrigation schedules — the gap between what a head is rated to deliver and what it actually delivers once installed, pressurized, and aged. The runtime the calculator returns is grounded in reality in a way that model-based estimates cannot be.
The single biggest mistake to avoid after running the calculation: ignoring the cycle-and-soak flag. A correct runtime programmed as one long session on compacted or clay-heavy soil produces runoff, not root-zone hydration. Split long runtimes, observe the first few sessions, and adjust. For full soil-system awareness before finalizing your schedule, the field capacity and soil moisture calculator can help you understand how much water your soil actually holds between watering events — a useful cross-check on any calculated irrigation target.
Lead Data Architect
Umer Hayiat
Founder & Lead Data Architect at TheYieldGrid. I bridge the gap between complex agronomic data and practical growing, transforming verified agricultural science into accessible, mathematically precise tools and guides for serious growers.
View all tools & guides by Umer Hayiat →


