
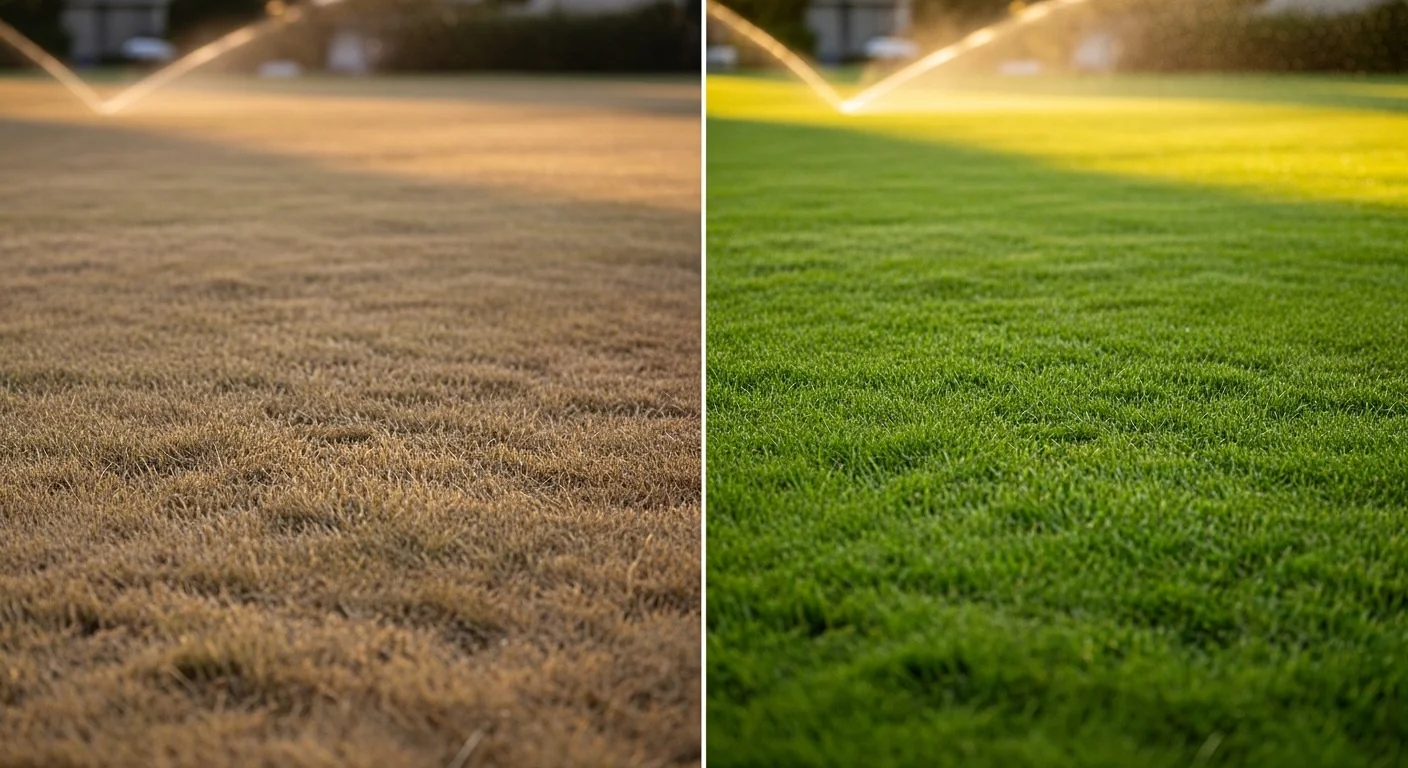
An irrigation system running 20 minutes per zone and still producing dry spots is not a scheduling problem. It is a physics problem. The volume of water hitting each square foot of turf varies depending on nozzle spacing, head alignment, pressure, and overlap pattern. That variation is what the catch can test quantifies. Without measuring it, increasing runtime is guesswork with a water bill.
This irrigation catch can test calculator takes the volumes you collect in each physical cup, computes your zone’s Distribution Uniformity (DU) using the lowest-quarter method defined by the Irrigation Association, and returns an adjusted runtime recommendation. It does not account for evapotranspiration demand, soil type, or run-off thresholds. Those are separate calculations. What it does tell you, precisely, is whether your sprinkler coverage pattern is the root cause of turf stress.
After using this tool, you will know whether to change your timer or change your nozzles. Those are different fixes with opposite costs.
Use the Tool
Enter the number of cans above and press Tab or click here to generate the input fields.
| DU Range | Rating | Action Required | Adj. Runtime Factor |
|---|---|---|---|
| 90–100% | Excellent | Maintain system | ÷ 0.95 = 1.05× |
| 75–89% | Good | Minor tune-up only | ÷ 0.80 = 1.25× |
| 65–74% | Fair | Adjust heads & pressure | ÷ 0.70 = 1.43× |
| 55–64% | Below Average | Replace nozzles | ÷ 0.60 = 1.67× |
| 40–54% | Poor | System redesign needed | ÷ 0.47 = 2.13× |
| <40% | Failing | Do not increase runtime | Repair first |
Source: Irrigation Association ASABE standards. DU ≥ 80% is the professional target for residential turf zones.
How This Calculator Works
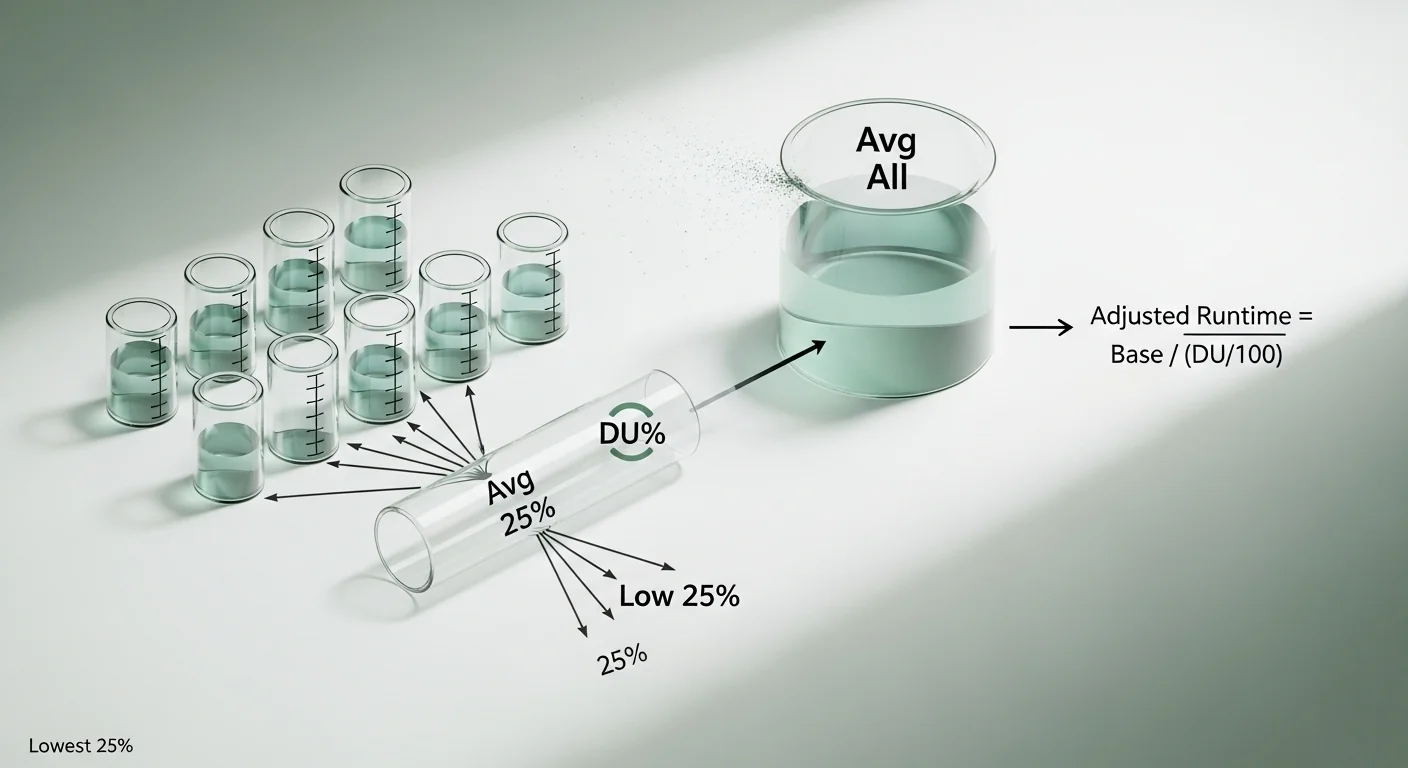
- Step 1 — Average of All Cans: Add up all collected volumes, divide by total number of cans.
Avg_Total = Sum(all volumes) ÷ N - Step 2 — Identify Lowest 25%: Sort all can values from lowest to highest. Take the bottom 25% of readings (round up if fractional).
Low25_count = ceil(N × 0.25) - Step 3 — Average of Lowest 25%: Average only those bottom-quarter readings.
Avg_Low25 = Sum(lowest 25% values) ÷ Low25_count - Step 4 — Distribution Uniformity:
DU_lq = (Avg_Low25 ÷ Avg_Total) × 100% - Step 5 — Adjusted Run Time: Compensate for poor uniformity so the driest areas receive adequate water.
AdjustedRuntime = BaseRuntime ÷ (DU_lq / 100) - Step 6 — Precipitation Rate (inches/hour): Converts ml measurements to estimated in/hr using a standard catch area assumption (6 in² per can).
PR = (Avg_Total_ml ÷ 16.387) ÷ (test_minutes ÷ 60)
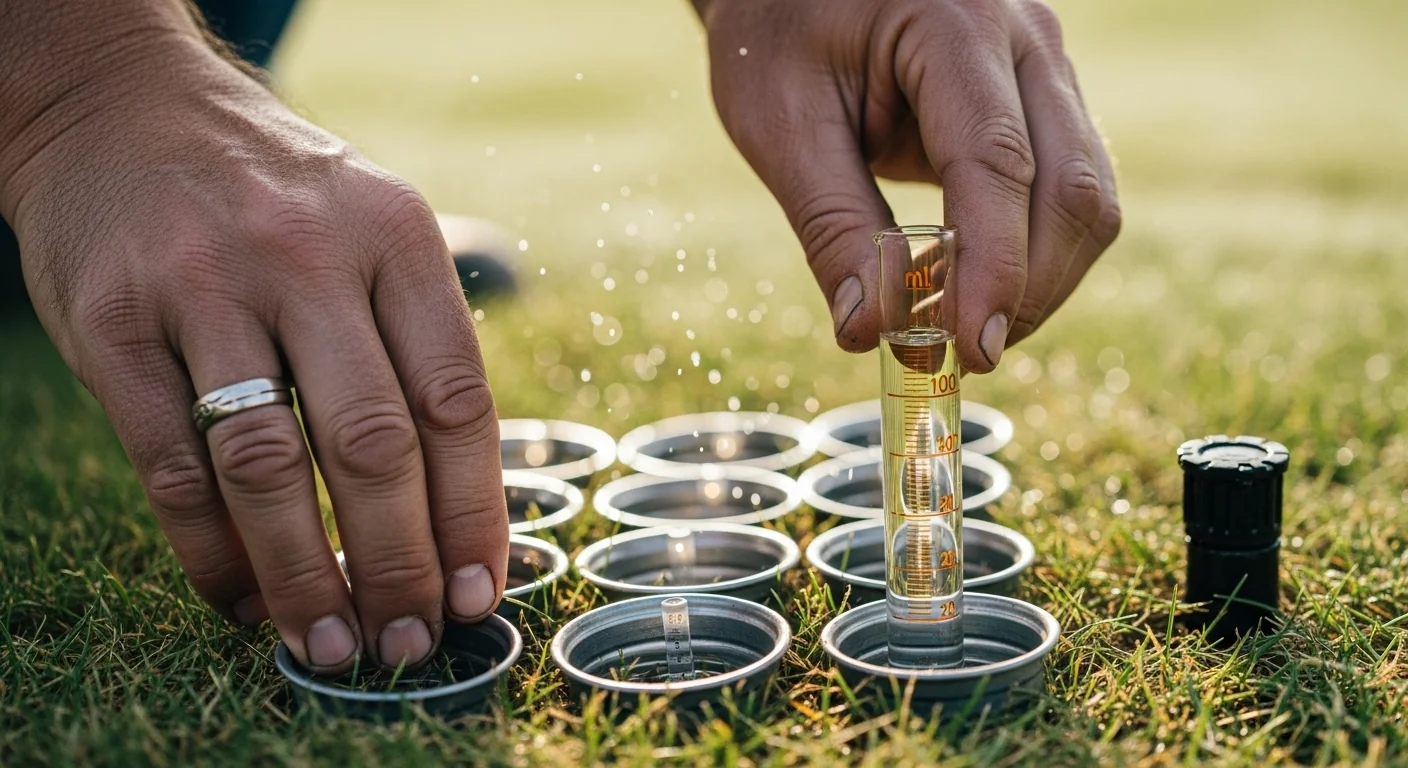
- Minimum 4 cans required; 12+ recommended for statistically valid results.
- Cans should be placed in a grid pattern covering the full zone, including overlap areas.
- Precipitation rate estimation assumes a ~6 in² effective catch opening (standard can).
- If unit is “inches,” DU is calculated directly — no conversion needed.
- Adjusted runtime addresses uniformity only — seasonal ET adjustments are separate.
- DU < 50%: the tool warns against simply extending runtime (The “Brown Spot Trap”).
- DU ≥ 80%: meets Irrigation Association professional standard for residential turf.
Assumptions & Limits
- Consistent water pressure during the test (no pressure fluctuations).
- Cans placed flat and level — tilted cans under-read.
- Wind speed under 10 mph during test — higher wind skews small-area readings.
- Single zone tested at a time — mixed zones produce misleading DU values.
- Test run time ≥ 10 minutes for ml accuracy; ≥ 15 min preferred.
- Tool does not account for soil infiltration rate or run-off.
- Precipitation rate is estimated — actual rate depends on can opening area and zone coverage.
- Adjusted runtime is a starting recommendation — observe actual soil moisture to fine-tune.
Before running the test, collect your measurements in consistent units. Every can should be read in the same unit (milliliters or inches of depth) using the same measuring device. Record your test run time at the controller. Have your current zone schedule (base runtime) ready so the adjusted runtime output is meaningful. If you need to verify your zone's base flow characteristics first, the hose flow rate calculator can help you cross-check system delivery before comparing catch volumes.
Quick Start (60 Seconds)
- Number of catch cans: Enter the total cans placed in the zone. Fewer than 4 cans produces statistically weak results; 12 or more covering the full zone in a grid pattern is standard practice.
- Volume unit: Choose milliliters if you measured with a graduated cylinder or syringe. Choose inches if you used a ruler inside a flat-bottomed cup with a known diameter.
- Run time of test: Enter the actual minutes the zone ran during data collection. Do not use your scheduled runtime; use the timer you observed. Enter only whole or half minutes.
- Desired base run time: Your current or target scheduled zone runtime in minutes. This is the number that gets adjusted, not the test run time.
- Can volumes (Step 2): After entering the number of cans and tabbing out, individual fields appear. Enter each can's reading. Zero is valid (a completely dry can is data). A blank field will block calculation.
- Unit consistency: The most common input mistake is mixing milliliters for some cans and teaspoons or fluid ounces for others. Convert everything to one unit before entering.
- Click Calculate: The results panel will not appear until all fields are filled and pass range validation. If a field has a red border, correct it before proceeding.
Inputs and Outputs (What Each Field Means)
| Field | Unit | What It Means | Common Mistake | Safe Entry Guidance |
|---|---|---|---|---|
| Number of Catch Cans | count | Total cups placed across the zone during the test | Using only 4 cans in a large zone; misses spatial variation | 4 to 36; minimum 12 recommended for zones larger than 1,000 sq ft |
| Volume Unit | ml or in | Measurement system used for all catch volumes | Switching units mid-test or estimating conversions manually | Pick one unit before the test begins; do not convert after the fact |
| Run Time of Test | minutes | Actual observed duration of zone operation during data collection | Using the scheduled runtime instead of the actual observed time | 1 to 120 min; 15 min minimum recommended for measurable volumes |
| Desired Base Run Time | minutes | Current or planned scheduled runtime you want to optimize | Entering the test duration here instead of the schedule duration | 1 to 120 min; use the runtime you actually program into the controller |
| Can Volumes (each) | ml or in | Volume collected in each individual catch cup | Leaving a cup blank because it "seemed low" rather than recording zero | Zero is valid data; all cans must be entered; range 0 and above |
| DU (Distribution Uniformity) | % | Ratio of the lowest-quarter average to the total average, expressed as a percentage | Confusing DU with coverage area or precipitation rate | Output only; range 0 to 100 |
| Average Volume (All Cans) | ml or in | Mean volume across all catch cups in the zone | Using this number alone without comparing to the low-quarter average | Output only; used as denominator in DU formula |
| Average Volume (Low 25%) | ml or in | Mean of the lowest-quarter readings; represents the driest areas of the zone | Not understanding that this is the numerator driving the DU score | Output only; a large gap between this and total average signals poor uniformity |
| Precipitation Rate | in/hr | Estimated depth of water applied per hour based on average catch and test time | Treating this as a precise flow measurement rather than an estimate | Output only; assumes standard 6 sq in catch opening; for precise rate use a matched precipitation rate calculator |
| Adjusted Run Time | minutes | Recommended new runtime that compensates for poor uniformity so driest areas receive adequate water | Applying this without first addressing nozzle issues; wastes water on already-wet areas | Output only; treat as a ceiling, not a target, when DU is below 75% |
Worked Examples (Real Numbers)
Example 1: Well-Maintained Residential Rotor Zone (12 Cans)
- Cans (ml): 45, 50, 38, 52, 41, 49, 36, 55, 43, 47, 39, 51
- Run time of test: 15 minutes
- Base runtime: 20 minutes
- Unit: ml
Total sum = 546 ml. Average of all cans = 45.50 ml. Sorted ascending: 36, 38, 39, 41, 43, 45, 47, 49, 50, 51, 52, 55. Lowest 25% count = ceil(12 x 0.25) = 3 cans: 36, 38, 39. Average of lowest 25% = 37.67 ml.
Result: DU = 37.67 / 45.50 x 100 = 82.8%. Adjusted runtime = 20 / 0.828 = 24.2 minutes.
This zone passes the Irrigation Association 80% professional threshold. The adjusted runtime of 24 minutes provides a modest buffer to ensure the driest corners receive adequate water. Minor head alignment adjustments could reduce this gap further.
Example 2: Neglected Zone with Clogged Heads (8 Cans)
- Cans (ml): 60, 22, 65, 18, 58, 25, 63, 20
- Run time of test: 15 minutes
- Base runtime: 15 minutes
- Unit: ml
Total sum = 331 ml. Average of all cans = 41.38 ml. Sorted ascending: 18, 20, 22, 25, 58, 60, 63, 65. Lowest 25% count = ceil(8 x 0.25) = 2 cans: 18, 20. Average of lowest 25% = 19.00 ml.
Result: DU = 19.00 / 41.38 x 100 = 45.9%. Adjusted runtime = 15 / 0.459 = 32.7 minutes.
This result triggers the Brown Spot Warning. Nearly doubling the runtime to 33 minutes would drench the high-output heads while barely satisfying the dry areas. The four cans reading 18 to 25 ml correspond to heads with blocked or worn nozzles. Fix those before touching the schedule.
Example 3: Spray Head Zone with Good Overlap (16 Cans)
- Cans (ml): 30, 28, 35, 32, 27, 33, 31, 29, 36, 26, 34, 30, 28, 33, 31, 32
- Run time of test: 15 minutes
- Base runtime: 18 minutes
- Unit: ml
Total sum = 495 ml. Average of all cans = 30.94 ml. Sorted ascending: 26, 27, 28, 28, 29, 30, 30, 31, 31, 32, 32, 33, 33, 34, 35, 36. Lowest 25% count = ceil(16 x 0.25) = 4 cans: 26, 27, 28, 28. Average of lowest 25% = 27.25 ml.
Result: DU = 27.25 / 30.94 x 100 = 88.1%. Adjusted runtime = 18 / 0.881 = 20.4 minutes.
A narrow spread between lowest and highest readings indicates well-matched nozzles and good overlap design. A 2-minute extension over the base schedule is all that is needed to compensate for edge variation. This zone should be re-tested once per season to catch degradation early.
Reference Table (Fast Lookup)
| DU Range | Rating | Scheduling Coefficient (SC = 100/DU) | Adj Runtime (20 min base) | Adj Runtime (30 min base) | Recommended Action |
|---|---|---|---|---|---|
| 95-100% | Excellent | 1.05 | 21 min | 32 min | Maintain; seasonal audit only |
| 85-94% | Very Good | 1.11-1.18 | 22-24 min | 33-35 min | Minor head fine-tuning optional |
| 75-84% | Good (IA threshold) | 1.19-1.33 | 24-27 min | 36-40 min | Adjust arc/radius on lowest-output heads |
| 65-74% | Fair | 1.35-1.54 | 27-31 min | 41-46 min | Replace worn nozzles; check pressure |
| 55-64% | Below Average | 1.56-1.82 | 31-36 min | 47-55 min | Nozzle replacement; pressure audit required |
| 45-54% | Poor | 1.85-2.22 | 37-44 min | 56-67 min | Do not increase runtime; redesign spacing |
| 35-44% | Failing | 2.27-2.86 | 45-57 min | 68-86 min | System redesign; heads mismatched or blocked |
| Less than 35% | Critical | Greater than 2.86 | Greater than 57 min | Greater than 86 min | Repair first; runtime adjustment is counterproductive |
Scheduling Coefficient (SC) is the inverse of DU expressed as a decimal. SC represents how many times more water the best-covered areas receive compared to the minimum needed. At SC = 2.0, the wettest areas are receiving twice the water the driest areas receive.
How the Calculation Works (Formula + Assumptions)
Show the calculation steps
Step-by-Step Formula
- Collect all can values. N = total number of cans. Record every value including zeros.
- Compute the total average. Add all volumes together and divide by N.
Avg_Total = Sum(all volumes) / N - Identify the lowest 25% of readings. Sort all values from lowest to highest. Take the bottom quarter.
Low25_count = ceil(N x 0.25)
If N = 12, Low25_count = ceil(3.0) = 3. If N = 10, Low25_count = ceil(2.5) = 3. - Compute the low-quarter average.
Avg_Low25 = Sum(lowest Low25_count values) / Low25_count - Calculate DU.
DU_lq = (Avg_Low25 / Avg_Total) x 100
Result is a percentage between 0 and 100. Round to one decimal place. - Calculate the adjusted runtime.
AdjustedRuntime = BaseRuntime / (DU_lq / 100)
Round to the nearest whole minute for controller programming. - Estimate precipitation rate (ml input only).
Convert average ml to cubic inches: avg_in3 = Avg_Total_ml / 16.387
Divide by assumed catch area: depth_in = avg_in3 / 6.0
Convert to per-hour rate: PR = depth_in / (test_minutes / 60)
Result in inches per hour, rounded to three decimal places.
Rounding Rules
DU is displayed to one decimal. Adjusted runtime is rounded to the nearest whole minute. Precipitation rate is shown to three decimal places. Average volumes are shown to two decimal places in intermediate outputs.
Unit Handling
If the unit is set to inches, volume values are treated as depth measurements. Avg_Total and Avg_Low25 are computed identically. The precipitation rate calculation bypasses the ml-to-cubic-inch conversion and uses the average inch depth directly divided by test hours.
Assumptions and Limits
- The catch can opening is assumed to be approximately 6 square inches for the precipitation rate estimate. Standard Orbit or similar catch cups typically fall in this range; custom containers will produce a different effective rate.
- The formula assumes no wind interference. Wind above 10 mph causes measurement error in open-top containers and makes results unreliable.
- Pressure is assumed constant throughout the test. If other zones or fixtures draw from the same supply line during the test, readings will not reflect true operating conditions.
- The tool tests one zone at a time. Mixed-head zones (rotors and sprays on the same valve) cannot be accurately characterized by a single DU value because their application rates differ by design.
- Adjusted runtime addresses uniformity only. Seasonal evapotranspiration demand is a separate input. Using adjusted runtime without consulting an evapotranspiration calculator may still result in under- or over-watering depending on the season.
- The lowest-quarter method (DU_lq) is industry-standard but represents a statistical floor. It does not identify which physical heads are low-performing; that requires walking the zone and comparing individual can readings to a zone map.
- A minimum of 4 cans is enforced by the tool, but statistical confidence below 12 cans is limited for zones larger than a few hundred square feet.
- Zero-volume readings from a can knocked over during the test will artificially deflate DU. Re-run the test if any can is disturbed.
Standards, Safety Checks, and "Secret Sauce" Warnings
Critical Warnings
- The Brown Spot Overwatering Trap: When DU falls below 50%, the adjusted runtime the formula returns can be more than double the base schedule. Applying that extended runtime does not fix the dry spots. It over-saturates the already-wet areas around well-functioning heads while the blocked or misaligned heads continue to under-apply water in exactly the same pattern. The fix is mechanical, not mathematical. Unclogging nozzles, replacing worn MPR tips, or correcting head-to-head spacing must come before any schedule change.
- Do not use DU as a substitute for a pressure test: A low DU score may reflect pressure variation rather than physical head problems. If supply pressure fluctuates more than 10 psi during the test, nozzle replacement alone will not solve the uniformity issue. A pressure gauge at the head is a separate diagnostic step. See the irrigation pump sizing calculator to verify whether your pump is delivering adequate and consistent pressure to the zone.
- Adjusted runtime is a ceiling when DU is low: The formula produces a mathematically correct runtime to satisfy the driest area. At DU values below 65%, that number frequently exceeds any agronomically reasonable runtime for the soil type. Silty or clay soils with low infiltration rates will run off long before the dry spots absorb enough water to respond. Check your soil infiltration rate before programming a significantly longer runtime.
- Re-test after head adjustments: DU is a snapshot, not a certification. Any change to nozzle type, arc setting, pressure, or spacing changes the result. A pre-adjustment baseline followed by a post-adjustment test is the only way to verify that a physical fix actually improved uniformity.
Minimum Standards
- The Irrigation Association sets 80% DU as the professional minimum for residential turf zones. This calculator uses 75% as the "good" threshold and 80% as the target to align with that benchmark.
- ASABE (American Society of Agricultural and Biological Engineers) standards for agricultural sprinkler systems use DU_lq as the primary uniformity metric, the same method this tool implements.
- For sports turf, golf course fairways, and commercial landscapes, many specifications require DU greater than 85%, reflecting the higher precision demand of those applications.
Competitor Trap: Most irrigation runtime calculators let you enter your zone area and precipitation rate, then output a schedule. None of that math tells you whether that schedule is actually delivering water evenly across the zone. A system running 30 minutes at a measured 0.5 in/hr might apply only 0.15 inches to a corner being underserved by a clogged head. The total schedule time is correct; the distribution is failing. The catch can test is the only diagnostic that exposes this, and the only calculators that implement it correctly are ones that use the lowest-quarter DU method rather than averaging all readings together.
Common Mistakes and Fixes
Mistake: Placing Cans Only in the Center of the Zone
Sprinkler coverage is typically weakest at the edges and corners of a zone, precisely where head-to-head overlap is most critical. A test using cans clustered in the middle of the throw pattern captures the high-overlap core and systematically overestimates DU. Edge and corner dry spots never show up in the data because no can was placed there. Fix: place cans in a uniform grid, including within two feet of each head, in the midpoints between heads, and in the corners of the zone boundary.
Mistake: Running the Test During Wind
Rotary heads and fixed spray heads both lose measurable volume to drift in even moderate wind, and the drift is not uniform across the zone. Catches on the leeward side of the zone will read high; upwind cans will read low. The resulting DU score reflects weather conditions rather than system performance. Fix: run the test at dawn or early morning when wind is typically calm, and reschedule if wind exceeds 5 to 7 mph.
Mistake: Mixing Head Types on One Valve and Testing as a Single Zone
A zone combining rotors (typically 0.4 to 0.6 in/hr) with fixed sprays (typically 1.0 to 2.0 in/hr) has fundamentally mismatched precipitation rates by design. The catch can test will produce a DU score for that mixed pattern, but that score cannot be improved by nozzle adjustment alone because the two head types will never match each other. This is a design flaw, not a maintenance issue. Fix: separate head types onto dedicated valves or replace all heads with matched precipitation rate (MPR) nozzles that deliver the same application rate regardless of arc.
Mistake: Comparing Test Results from Different Run Times
DU is dimensionless and runtime-independent, so comparing two test results across different run times is valid. The precipitation rate output is not. Comparing a 10-minute test precipitation rate to a 20-minute test rate from the same zone will produce different numbers due to accumulation timing and any pressure variation over the run. Fix: standardize test run time to 15 minutes as a baseline for all comparative tests and document the run time alongside every DU result.
Mistake: Using the Adjusted Runtime Without Verifying Soil Absorption
A zone with DU of 55% might require 36 minutes or more to satisfy the driest area. If the native soil has a low infiltration rate, water will begin ponding or running off after 10 to 15 minutes regardless of what the runtime formula suggests. The adjusted runtime becomes meaningless if the soil cannot absorb water faster than it is being applied. Fix: cycle the runtime in 10 to 12 minute intervals with 30-minute soak periods to allow infiltration, and check your field capacity and soil moisture data before committing to a single-cycle long runtime.
Next Steps in Your Workflow
Once you have your DU score and adjusted runtime, the immediate next step is to identify which physical heads correspond to your lowest-reading cans. Mark those locations during the test, then walk the zone while it runs and observe flow patterns, arc coverage, and radius throw. If a head is delivering noticeably less volume than adjacent ones, it is either clogged, worn, incorrectly adjusted, or operating at lower pressure due to line restriction. Address those heads first, then re-run the catch can test before changing the schedule.
If your DU is already above 75% and you are primarily looking to dial in your schedule, the sprinkler run time calculator can help you refine your runtime based on weekly water needs, and the drip irrigation run time calculator is available if you are working with a mixed system that includes drip zones alongside your spray or rotor zones.
FAQ
What is a good DU score for a residential lawn?
The Irrigation Association sets 80% DU as the professional standard for residential turf zones. Scores between 75% and 80% are acceptable with minor head adjustments. Below 75%, the zone has measurable coverage gaps that will produce dry spots under normal scheduling conditions regardless of how long the controller runs.
How many catch cans do I need for an accurate test?
A minimum of 4 cans is required to compute the lowest-quarter average, but statistical accuracy improves significantly with 12 or more cans placed in a grid across the full zone area. For zones larger than 1,000 square feet, 16 to 20 cans are common in professional irrigation audits. Fewer cans increase the chance that a poorly covered area is missed entirely.
Can I use cups from the kitchen instead of professional catch cups?
Yes, as long as every cup is identical in diameter and you read volumes in consistent units. The shape of the catch area affects the precipitation rate output, but DU itself is a ratio between can readings, so identical cups cancel out that variable. Inconsistent container sizes will skew the comparison between cans and produce an unreliable DU.
Why does the adjusted runtime sometimes seem unreasonably long?
The adjusted runtime formula divides your base schedule by DU expressed as a decimal. At very low DU values, such as 40%, the divisor is 0.40, which multiplies runtime by 2.5. That mathematically accurate output is a signal that the system needs physical repair, not that you should program 2.5 times the original runtime. At DU below 50%, the tool displays a critical warning for exactly this reason.
What causes low DU in a system that was installed correctly?
Four degradation mechanisms are most common: nozzle wear and mineral buildup reducing output in individual heads; heads settling or tilting over time and misaligning arc coverage; pressure changes from new construction, added zones, or pipe deterioration; and seasonal plant growth or soil heave blocking or misdirecting spray patterns. A system that tested well at installation can degrade to poor DU over two to three seasons without maintenance.
Does this DU method apply to drip irrigation systems?
The catch can test and lowest-quarter DU formula are designed for overhead sprinkler systems. Drip emitters are evaluated using emissions uniformity (EU), a related but different metric that accounts for emitter manufacturing variability and pressure variation through the lateral. The formulas use the same mathematical structure but the data collection method (pressure measurements vs physical catch volumes) is different. This calculator is not appropriate for drip uniformity audits.
Conclusion
The catch can test is the only way to know whether your irrigation system is distributing water evenly or concentrating it in high-overlap areas while leaving edges short. DU turns that physical measurement into a number you can act on: either the number is above 80% and a schedule adjustment is appropriate, or it is below 75% and the schedule is not the problem. That distinction is the tool's core value and what distinguishes it from any calculator that simply computes runtime from area and precipitation rate.
The single most expensive mistake in residential irrigation management is extending run time to compensate for a poorly uniformity system. It wastes water, accelerates fungal disease in over-watered zones, and never resolves the dry spot it was meant to fix. Run the catch can test, find the low-output heads, fix them mechanically, then use the adjusted runtime as your new starting point. If you are comparing system performance between zones or across seasons, the rainwater collection calculator can help you understand total water budget context alongside your zone-level efficiency data.
Lead Data Architect
Umer Hayiat
Founder & Lead Data Architect at TheYieldGrid. I bridge the gap between complex agronomic data and practical growing, transforming verified agricultural science into accessible, mathematically precise tools and guides for serious growers.
View all tools & guides by Umer Hayiat →


