
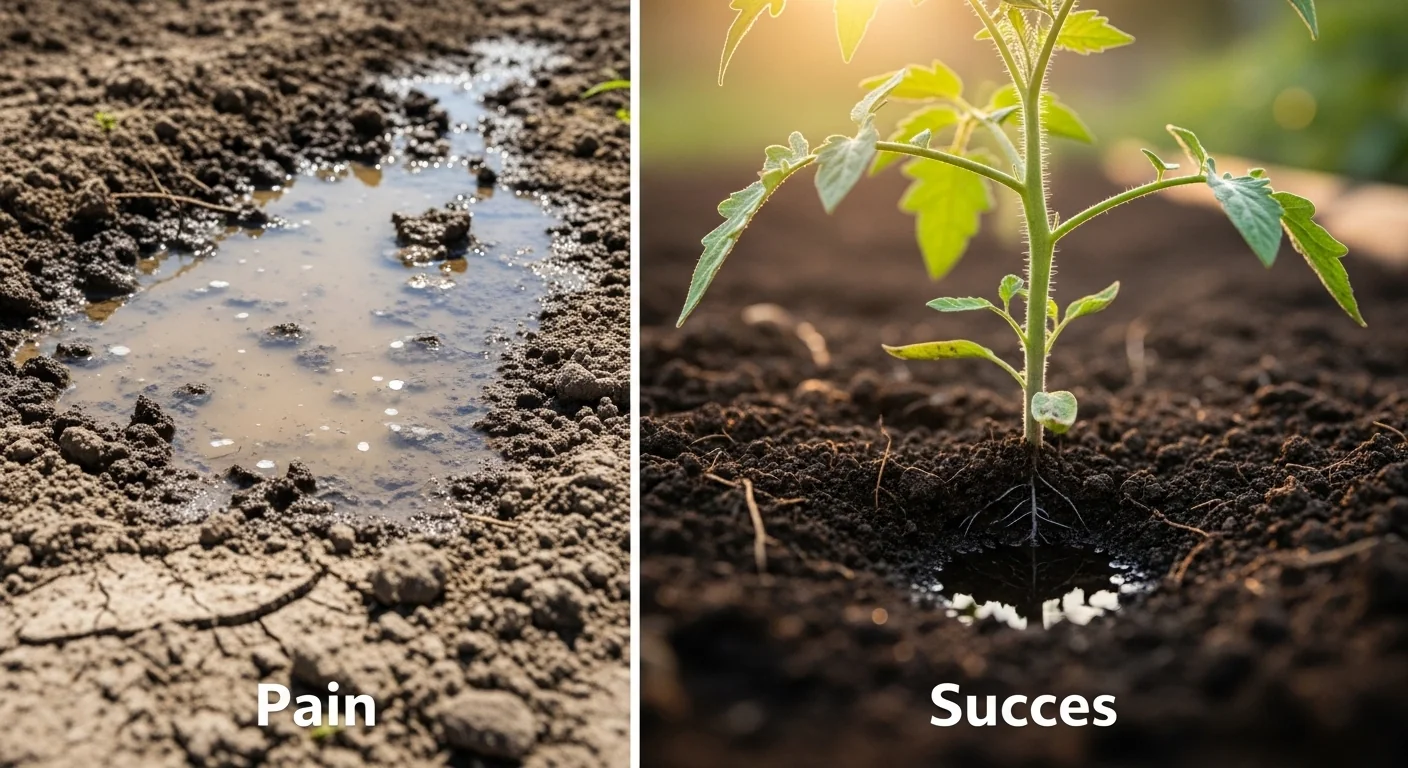
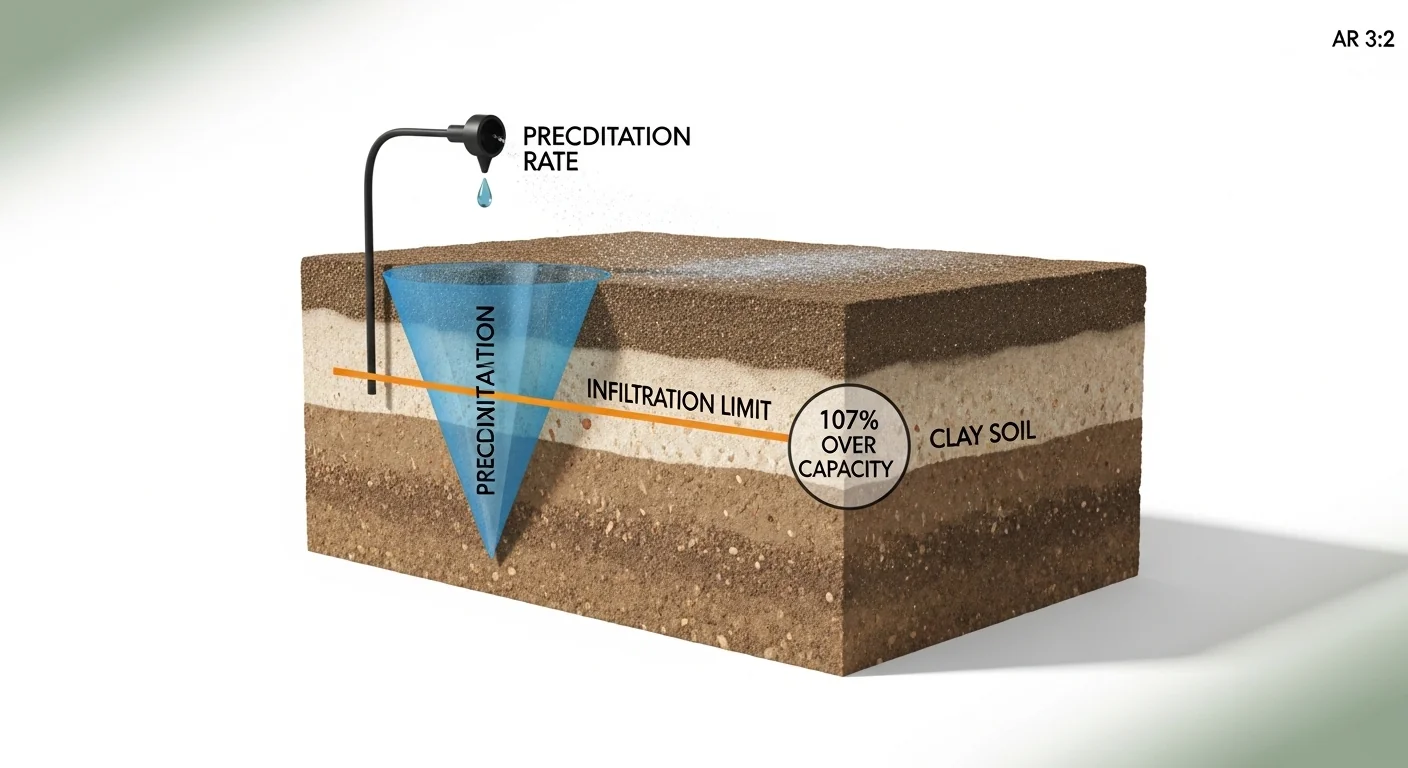
A drip system’s run time is not just a function of how long water flows. It is a function of how fast your soil can accept that water. A zone running 2.0 GPH emitters on clay for 60 continuous minutes will deliver the water to a puddle, not a root zone. The precipitation rate from drip emitters can easily exceed clay’s physical infiltration capacity, which sits near 0.1 to 0.5 inches per hour depending on compaction and organic matter content. Most published “how long to run drip” advice skips this entirely.
This tool calculates two outputs: the precipitation rate your emitter configuration delivers (in inches per hour), and the total zone run time required to meet a target application depth. It applies the 231.1 conversion factor used throughout the irrigation industry for area-based drip rate calculations. What it does not calculate is plant-specific water demand, evapotranspiration replacement, or slope-adjusted infiltration. For those adjustments, treat the run time this tool produces as a starting baseline, not a final value.
After running the calculator, you will know whether your current emitter layout can irrigate your soil type without runoff, and you will receive a soil-matched schedule, including mandatory Cycle and Soak cycles for clay, that you can program directly into your controller today.
Use the Tool
Drip Irrigation Run Time Calculator
Calculate precipitation rate, zone run time, and cycle & soak schedules for clay, loam, and sandy soils.
| Emitter (GPH) | Emitter Spacing (in) | Row Spacing (in) | Precip. Rate (in/hr) | Run Time for 1″ (min) |
|---|
How This Calculator Works
Step 1 — Calculate Precipitation Rate (PR):
Step 2 — Calculate Total Run Time:
Step 3 — Apply Soil-Specific Scheduling:
Sand: Water absorbs quickly. Use short, frequent runs (multiple times per day if needed). No cycle & soak needed.
Loam: Balanced infiltration. Standard single-run scheduling is fine. Excellent moisture retention.
Clay: Slow infiltration (~0.1–0.5 in/hr). Mandatory Cycle & Soak: Run for 15 minutes, pause 30 minutes to allow absorption, repeat until total run time is achieved. Running longer without pausing causes surface puddling and runoff — roots stay dry even though water is applied.
Assumptions & Limits
- All emitters in the zone are the same GPH rating (uniform distribution assumed).
- Emitter and row spacing are uniform throughout the zone.
- Pressure is consistent at 20–30 PSI — use a 25 PSI pressure regulator for best results.
- Infiltration rates: Sand ≈ 0.75–2.0 in/hr; Loam ≈ 0.3–0.75 in/hr; Clay ≈ 0.05–0.5 in/hr.
- Clay cycle & soak uses 15-min run / 30-min pause cycles (industry standard recommendation).
- Sand short-run recommendation: split total run time into 2–3 cycles per day to reduce percolation loss below root zone.
- Calculator does not account for slope, root zone depth variation, or plant-specific ET (evapotranspiration).
- Input ranges: GPH 0.1–10, Emitter spacing 4–72 in, Row spacing 4–120 in, Target depth 0.1–6 in.
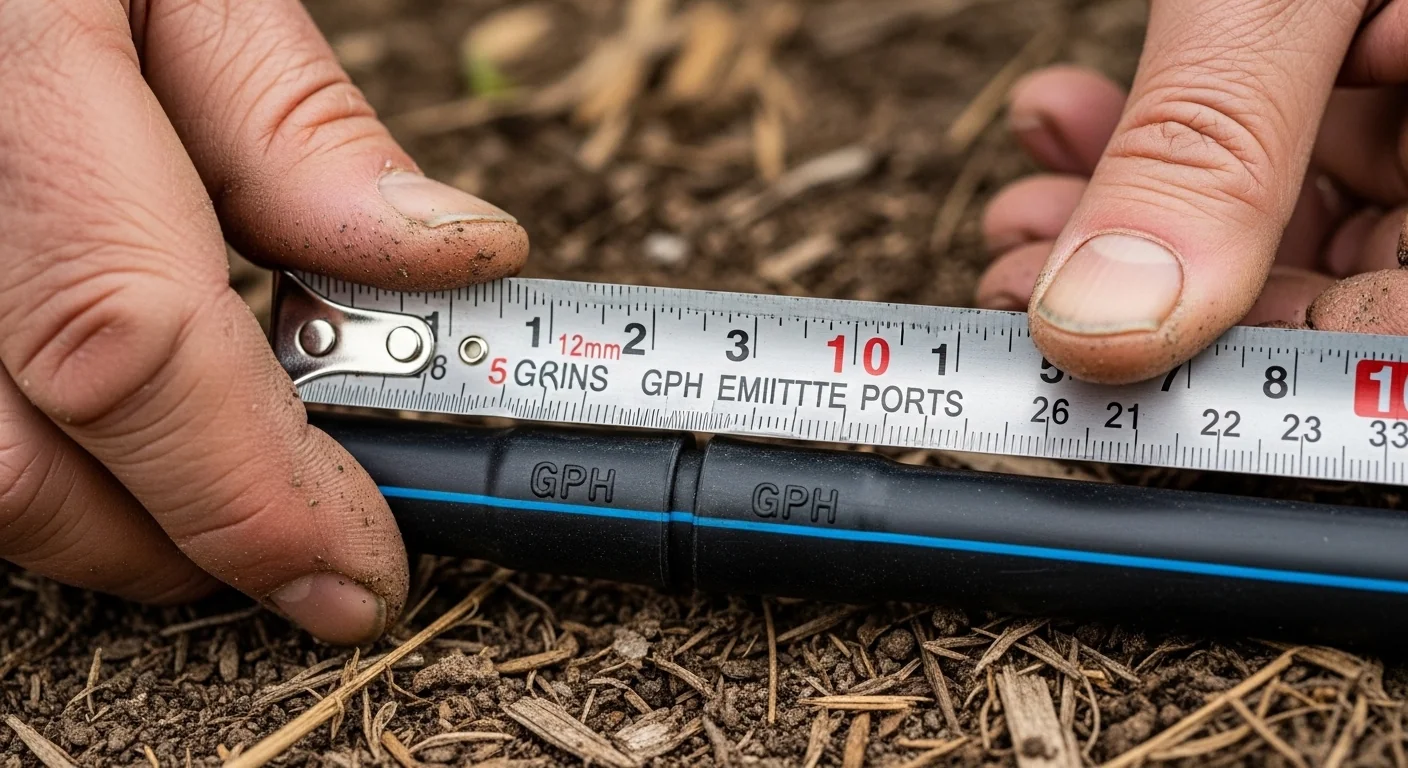
Before you begin, have the following on hand: the GPH rating printed on your emitter bodies (0.5, 1.0, and 2.0 GPH are the most common residential sizes), a tape measure for emitter-to-emitter distance along the tube and the distance between parallel drip lines, a soil type identification for your zone (a simple texture test or past soil test report works), and your target application depth in inches. If you are unsure how much water your current drip layout is actually distributing across the soil surface, the irrigation catch-can test calculator can help you verify distribution uniformity before scheduling.
Quick Start (60 Seconds)
- Emitter Flow Rate (GPH): Read the GPH value embossed on the emitter body or from the product spec sheet. Common values are 0.5, 1.0, and 2.0 GPH. Do not average mixed emitter types in one zone; mixed zones require separate calculations.
- Emitter Spacing: Measure in inches from the center of one emitter to the center of the next emitter along the same drip line. This is not the distance between drip lines. Typical ranges are 6 to 24 inches.
- Row Spacing: Measure in inches between parallel drip lines. For single-row raised beds, this value equals the bed width the one tube serves. Enter the actual physical spacing, not the plant row spacing.
- Soil Type: Choose the primary texture. If your soil is a clay-loam mixture, select Clay for a conservative schedule. When in doubt, test a small patch by running your system for 20 minutes and checking whether water puddles or absorbs.
- Target Irrigation Depth: Enter how many inches of water you want to apply per session. A common starting point for vegetable beds is 0.5 to 1.0 inch, and for established landscape shrubs, 1.0 to 1.5 inches. Do not enter daily ET demand directly here unless you have already accounted for soil storage capacity.
- Unit check: All spacing inputs are in inches, not centimeters or feet. Converting feet to inches before entering prevents the single most common input error.
- Run the calculation only after all five fields are filled. The tool holds results until every required input is valid to prevent partial outputs.
Inputs and Outputs (What Each Field Means)
| Field | Unit | What It Means | Common Mistake | Safe Entry Guidance |
|---|---|---|---|---|
| Emitter Flow Rate | GPH (gallons per hour) | The rated output of a single drip emitter at design operating pressure (typically 20 to 30 PSI). This is a per-emitter value, not a zone total. | Entering the total zone flow rate instead of the per-emitter rate. A zone with 40 emitters at 1.0 GPH each is not 40 GPH per emitter. | Check the emitter label or manufacturer spec. Valid range: 0.1 to 10 GPH. |
| Emitter Spacing | Inches | Center-to-center distance between consecutive emitters along a single drip tube. Determines how densely the tube delivers water per linear foot. | Confusing emitter spacing with row spacing. These are perpendicular measurements. | Measure along the tube direction only. Valid range: 4 to 72 inches. |
| Row Spacing | Inches | Center-to-center distance between parallel drip lines covering the same irrigated area. This sets the coverage width each tube is responsible for. | Using plant spacing instead of actual tube-to-tube spacing. Plant spacing and drip line spacing are often different. | Measure the physical gap between drip lines on the ground. Valid range: 4 to 120 inches. |
| Soil Type | Category (Sand / Loam / Clay) | The dominant soil texture in the zone. Determines the soil’s maximum water acceptance rate (infiltration rate) and whether Cycle and Soak programming is required. | Selecting Loam for clay-loam or silty-clay soils. Heavy mixed soils behave closer to Clay under sustained irrigation. | When uncertain, select the heavier option. It produces the more conservative, safer schedule. |
| Target Irrigation Depth | Inches | The depth of water you want to add to the soil per irrigation session. This is an application depth, not root depth. It drives total run time directly. | Entering root zone depth (e.g., 12 inches) instead of water application depth (e.g., 1 inch). These are not the same number. | Use 0.5 to 1.5 inches for most garden and landscape zones. Valid range: 0.1 to 6 inches. |
| Precipitation Rate (output) | Inches per hour (in/hr) | The rate at which the emitter layout delivers water to the soil surface, expressed as an equivalent depth per hour. This is the primary diagnostic number for soil matching. | Treating a high precipitation rate on clay as acceptable because the emitters are “slow drip.” Precipitation rate depends on spacing, not just GPH. | Compare to your soil’s infiltration rate. If PR exceeds the soil’s intake rate, runoff occurs regardless of emitter size. |
| Total Run Time (output) | Minutes | Total irrigation time needed to deliver the target depth at the calculated precipitation rate. For clay, this must be split into Cycle and Soak segments; it cannot be applied continuously. | Programming the controller for the full continuous run time on clay soil. Water will puddle and run off the surface long before completion. | For clay, use the Cycle and Soak schedule generated by the tool, not the raw total minutes output. |
Worked Examples (Real Numbers)
Example 1: Sandy Raised Bed, Low-Volume Emitters
- Emitter Flow Rate: 0.5 GPH
- Emitter Spacing: 12 inches
- Row Spacing: 12 inches
- Soil Type: Sand
- Target Depth: 0.75 inches
Result: PR = (231.1 x 0.5) / (12 x 12) = 115.55 / 144 = 0.803 in/hr. Run Time = (0.75 / 0.803) x 60 = approximately 56 minutes total.
Sand absorbs water quickly, but 56 continuous minutes risks pushing moisture well below the root zone through deep percolation. Splitting this into two or three runs of roughly 18 to 20 minutes each across the day keeps water available in the top 12 inches where roots actively feed.
Example 2: Loam Vegetable Row, Standard Emitters
- Emitter Flow Rate: 1.0 GPH
- Emitter Spacing: 18 inches
- Row Spacing: 24 inches
- Soil Type: Loam
- Target Depth: 1.0 inch
Result: PR = (231.1 x 1.0) / (18 x 24) = 231.1 / 432 = 0.535 in/hr. Run Time = (1.0 / 0.535) x 60 = approximately 112 minutes.
Loam’s balanced structure handles 0.535 in/hr without surface runoff. A single 112-minute run is appropriate here. No Cycle and Soak required, though splitting into two 56-minute windows on very hot days can reduce evaporative losses from the soil surface near emitters.
Example 3: Clay Landscape Bed, High-Output Emitters (The “Surface Puddle” Scenario)
- Emitter Flow Rate: 2.0 GPH
- Emitter Spacing: 18 inches
- Row Spacing: 24 inches
- Soil Type: Clay
- Target Depth: 1.0 inch
Result: PR = (231.1 x 2.0) / (18 x 24) = 462.2 / 432 = 1.070 in/hr. Run Time = (1.0 / 1.070) x 60 = approximately 56 minutes total.
This is the scenario the tool is specifically designed to catch. Clay soil’s maximum infiltration rate is approximately 0.1 to 0.5 in/hr. A precipitation rate of 1.070 in/hr exceeds that limit by a factor of two or more, guaranteeing surface puddling and runoff within the first few minutes of operation. The tool will flag this as exceeding the soil infiltration threshold and output a mandatory Cycle and Soak schedule: run 15 minutes, pause 30 minutes to let water absorb, repeat. Despite the puddle appearing on the surface, the deep roots in this scenario can remain completely dry.
Reference Table (Fast Lookup)
All precipitation rates computed using PR = (231.1 x GPH) / (Emitter Spacing x Row Spacing). Run times calculated for 0.5″ and 1.0″ target depths. Soil match column reflects the strictest matching soil type based on standard infiltration ranges.
| GPH | Emitter Spacing (in) | Row Spacing (in) | PR (in/hr) | Run Time for 0.5″ (min) | Run Time for 1.0″ (min) | Soil Match |
|---|---|---|---|---|---|---|
| 0.5 | 12 | 12 | 0.803 | 37 | 75 | Sand or Loam |
| 0.5 | 18 | 18 | 0.357 | 84 | 168 | All soils |
| 1.0 | 12 | 12 | 1.605 | 19 | 37 | Sand only |
| 1.0 | 12 | 18 | 1.070 | 28 | 56 | Sand / marginal Loam |
| 1.0 | 18 | 24 | 0.535 | 56 | 112 | Sand or Loam |
| 1.0 | 24 | 24 | 0.401 | 75 | 150 | Sand, Loam, or Clay (marginal) |
| 2.0 | 12 | 18 | 2.141 | 14 | 28 | Sand only |
| 2.0 | 18 | 24 | 1.070 | 28 | 56 | Sand / marginal Loam |
| 2.0 | 24 | 24 | 0.803 | 37 | 75 | Sand or Loam |
| 2.0 | 36 | 36 | 0.357 | 84 | 168 | All soils including Clay |
The table illustrates a counterintuitive point: a 2.0 GPH emitter at 36-inch spacing in both directions produces the same precipitation rate as a 0.5 GPH emitter at 18-inch spacing. Flow rate alone does not determine how much water hits a square foot of soil per hour. Spacing is an equally powerful variable.
How the Calculation Works (Formula + Assumptions)
Show the calculation steps
Step 1: Calculate Precipitation Rate
The formula converts per-emitter flow (in gallons per hour) into an equivalent rainfall depth (inches per hour) across the area served by each emitter.
PR (in/hr) = (231.1 x GPH) / (Emitter Spacing x Row Spacing)
The constant 231.1 comes from the unit conversion chain: one U.S. gallon equals 231 cubic inches. Dividing cubic inches per hour by the emitter’s coverage area in square inches yields inches per hour. Spacing values must both be in inches for the result to be in in/hr.
Step 2: Calculate Total Run Time
Run Time (hours) = Target Depth (inches) / PR (in/hr)
Run Time (minutes) = Run Time (hours) x 60
Results are rounded to the nearest whole minute for controller programming. Sub-minute precision has no practical meaning for mechanical or electronic timer settings.
Step 3: Apply Soil-Specific Scheduling Correction
The raw run time from Step 2 is valid only if the precipitation rate does not exceed the soil’s infiltration capacity. When PR exceeds the soil’s intake rate, that run time must be split into cycles separated by soak pauses. For clay, the standard Cycle and Soak protocol uses 15-minute run segments and 30-minute soak pauses, repeating until the total run time accumulates. The tool calculates the number of required cycles automatically.
Assumptions and Limits
- All emitters in the zone are the same rated GPH. Mixed-emitter zones require separate calculations per emitter type.
- Operating pressure is consistent at 20 to 30 PSI throughout the zone. Emitters rated at 1.0 GPH at 25 PSI will deliver less at 15 PSI and more at 40 PSI. Install a 25 PSI pressure regulator at the valve to stabilize output.
- Emitter and row spacing are uniform across the entire zone. Irregular spacing produces irregular precipitation distribution not captured by this formula.
- Infiltration rate ranges used: Sand approximately 0.75 to 2.0 in/hr, Loam approximately 0.3 to 0.75 in/hr, Clay approximately 0.05 to 0.5 in/hr. Real-world values vary with compaction, organic matter, and existing moisture level.
- The Clay Cycle and Soak protocol uses 15-minute run segments and 30-minute soak pauses as the industry-standard default. Some highly compacted clay soils may require shorter run segments (10 minutes) and longer pauses (45 minutes). Observe surface conditions during the first scheduled run and adjust if puddling occurs before the 15-minute mark.
- The formula does not account for slope. On grades above roughly 2 to 3 degrees, surface runoff risk increases even for loam soils because lateral water movement occurs before vertical infiltration can absorb the application.
- No evapotranspiration (ET) correction is applied. The target depth you enter should already reflect crop demand or be treated as a one-time application, not a daily ET replacement without further adjustment. Determine your ET-based target depth separately before entering it here.
- Soil moisture at the time of irrigation is not modeled. A soil already at field capacity accepts far less additional water before runoff than the infiltration rate suggests. For field capacity context, see the field capacity and soil moisture calculator.
Standards, Safety Checks, and “Secret Sauce” Warnings
Critical Warnings
- The Clay Puddle Trap: Applying water faster than the soil can absorb it is not a minor inefficiency. On clay, surface water can pond, evaporate, and run downslope entirely without penetrating the root zone. A homeowner running 2.0 GPH emitters at 18-inch spacing on heavy clay delivers a precipitation rate near 1.07 in/hr against a soil that may accept only 0.1 to 0.2 in/hr under saturated conditions. The tool detects this and mandates Cycle and Soak programming. Ignoring this flag means deep roots stay dry regardless of how many gallons the zone runs. Use the soil infiltration rate calculator to measure your actual intake rate if you are uncertain which soil category applies.
- Sand Deep Percolation Risk: Sandy soil’s high infiltration rate is frequently misread as “safe to run longer.” Continuous long runs on sand push moisture below the effective root zone through deep percolation before plants can access it. Short, frequent cycles deliver the same total volume while keeping water within root reach.
- Pressure Deviation Degrades GPH Accuracy: The precipitation rate formula assumes emitters are delivering their rated GPH. Without a pressure regulator at the zone valve, actual output can differ meaningfully from the rated value, invalidating the calculated run time. Pressure-compensating (PC) drip emitters reduce this error across a wider pressure range and are strongly recommended for zones with any elevation change. For gravity-fed systems with limited head pressure, use the gravity-fed drip irrigation calculator to verify that operating pressure remains within the emitter’s compensation range.
- Clogged Emitters Skew Actual PR: Emitters partially blocked by mineral deposits or biofilm deliver below-rated GPH, lowering the actual precipitation rate and extending effective run time beyond what the calculator shows. A 150-mesh screen filter at the valve head prevents most clogging. Flush the system at the start of each season.
Minimum Standards
- Clay soil zones must use Cycle and Soak programming. A single continuous run exceeding the soil’s intake rate is not a valid scheduling approach regardless of total run time.
- All drip systems should include a pressure regulator (25 PSI is the standard residential setting) and a screen filter (150 mesh minimum) ahead of the drip tubing. These two components are non-negotiable for rated-GPH accuracy and emitter longevity.
- Any zone where the calculated precipitation rate exceeds the soil’s infiltration threshold must either reduce emitter GPH, increase emitter spacing, increase row spacing, or implement Cycle and Soak. Running the zone as-is produces runoff and wastes water without meaningfully increasing root zone moisture.
Competitor Trap
Most “drip run time” pages and apps calculate total run time as a straightforward division of water volume by emitter flow rate, then present a single number without any reference to soil type or infiltration capacity. That approach produces a number that is technically derived but operationally wrong for clay soils. A user following that output will program their controller for a continuous run that causes surface puddling and lateral runoff, while their plant roots remain under-irrigated. The soil-matching step is not optional. It is the only step that determines whether the calculated run time is a valid controller setting or a number that needs to be restructured into cycles before it can be used. Tools that skip this step are answering the wrong question.
Common Mistakes and Fixes
Mistake: Using Total Zone Flow Instead of Per-Emitter GPH
A zone with 30 emitters rated at 1.0 GPH each has a total zone flow of 30 GPH, but the emitter flow rate input requires 1.0, not 30. Entering the total zone flow inflates the precipitation rate by a factor of 30 and produces a run time that is wildly too short. The formula divides a single emitter’s output by the area that one emitter covers, not the entire zone’s output by the zone area.
Fix: Always read the GPH value from a single emitter body or its product datasheet. If the zone uses multiple emitter types, calculate each type separately.
Mistake: Confusing Emitter Spacing With Row Spacing
Emitter spacing and row spacing are perpendicular measurements. Emitter spacing is along the tube (how far apart emitters are on a single line); row spacing is across the zone (how far apart the drip lines are). Swapping them produces an incorrect precipitation rate and a run time that does not match reality. The mistake is common on trellised or narrow raised-bed layouts where tubes run close together but emitters within each tube are widely spaced. For comparison, sprinkler run time calculations use head-to-head coverage areas differently, but the spacing discipline is equally critical in both systems.
Fix: Measure emitter spacing by laying a tape along one drip tube from center to center of consecutive emitter ports. Measure row spacing by laying a tape across the zone perpendicular to the tubes.
Mistake: Applying the Clay Run Time Continuously
When the tool outputs “74 minutes” for a clay soil zone, that is not a controller setting. It is the total water application time that must be delivered in segments. Programming a single 74-minute start-to-finish run on clay will produce surface puddling, lateral runoff, and wasted water, often within the first 15 to 20 minutes. This is the most consequential scheduling error this calculator is designed to prevent.
Fix: Use the Cycle and Soak schedule generated by the tool directly. For most clay zones, this means 15-minute run segments with 30-minute soak pauses repeated until the total run time is accumulated. Program this as multiple start times in your controller or use a controller with a built-in cycle-and-soak feature.
Mistake: Ignoring Operating Pressure
Emitter GPH ratings are accurate only within the emitter’s rated pressure range. Zones fed directly from household supply pressure without a regulator often operate at 40 to 60 PSI, well above the 20 to 30 PSI drip emitters are designed for. Non-pressure-compensating emitters at elevated pressure emit more than their rated GPH, increasing the actual precipitation rate above what the calculator predicts and potentially exceeding the soil’s infiltration threshold even when the tool shows a safe result. Using the matched precipitation rate calculator can help verify whether different zones in a system are delivering comparable rates.
Fix: Install a 25 PSI pressure regulator at each zone valve. Pressure-compensating (PC) emitters provide additional protection across a broader operating range.
Mistake: Entering Root Zone Depth as Target Irrigation Depth
Target irrigation depth is the depth of water applied to the soil surface per session, not the depth roots reach. A tomato plant with a 14-inch root zone does not need 14 inches of applied water per session. A typical session target for vegetables is 0.5 to 1.0 inches of water, which moves moisture through the top several inches of soil over multiple watering events. Entering “14” for a root zone depth into the target depth field produces a calculated run time that is unworkable.
Fix: Use 0.5 to 1.5 inches as the target depth for most garden and landscape zones. Match the frequency of irrigation to plant demand and soil drainage rate rather than trying to saturate the full root zone depth in a single session.
Next Steps in Your Workflow
Once you have your precipitation rate and run time in hand, the next task is verifying that your zone’s actual distribution matches the calculated value. Calculators assume perfect uniformity, but real-world drip systems have pressure variation from inlet to far end, partial emitter clogging, and elevation changes that alter actual output. Running a quick distribution uniformity check with catch cans before programming your final schedule saves time over repeatedly adjusting a controller based on plant stress signals.
After scheduling, revisit your run time seasonally as plant demand changes with temperature, day length, and growth stage. Summer peak demand can require substantially longer run times or higher frequency than the spring baseline. The evapotranspiration calculator will translate local weather data into crop-specific water demand so you can update your target depth with each season change. If your zone pressure has never been directly measured, the irrigation pump sizing calculator can help you determine whether your supply pressure and flow rate are sufficient to run the zone at rated emitter performance.
FAQ
What is a good precipitation rate for drip irrigation?
The answer depends entirely on soil type. For clay, the precipitation rate should stay under approximately 0.3 to 0.4 in/hr to avoid exceeding infiltration capacity. Loam handles up to about 0.5 to 0.75 in/hr. Sandy soils can typically absorb 0.75 in/hr and above without surface runoff. A precipitation rate that works well in one soil type can cause active runoff in another.
How do I calculate drip irrigation run time without a calculator?
Apply the formula directly: PR = (231.1 x GPH) divided by (Emitter Spacing in inches x Row Spacing in inches). Then divide your target depth in inches by the PR result, and multiply by 60 to get minutes. For clay soil, remember to split that total into 15-minute run segments with 30-minute soak pauses rather than running continuously.
Why does my drip system puddle even though the emitters are labeled “slow drip”?
Emitter flow rate alone does not determine whether puddling occurs. A 0.5 GPH emitter at 6-inch spacing produces a higher precipitation rate than a 2.0 GPH emitter at 36-inch spacing. The coverage area each emitter is responsible for is what governs surface delivery rate. On clay, even a low-GPH emitter at tight spacing can easily exceed the soil’s infiltration capacity.
Can I use this calculator for drip tape?
Yes, with one adjustment. Drip tape emitter spacing is the distance between inline emitter ports along the tape, and row spacing is the distance between tape rows. Enter these values in inches as you would for individual emitter setups. Drip tape flow rates are typically expressed per 100 feet rather than per emitter; convert to per-emitter GPH first by dividing by the number of emitters per 100 feet.
How does soil type affect drip irrigation scheduling?
Soil texture controls the maximum rate at which water moves from the soil surface into the profile. Clay particles pack densely, limiting intake speed dramatically compared to sand or loam. When a drip system delivers water faster than the soil accepts it, excess water moves laterally or pools at the surface. Soil type determines both whether Cycle and Soak is required and how long soak pauses need to be between run cycles.
What is the 231.1 constant in the precipitation rate formula?
One U.S. gallon equals exactly 231 cubic inches of volume. The constant 231.1 (sometimes cited as 231 in simplified versions) converts the per-emitter flow rate in gallons per hour into cubic inches per hour, which is then divided by the emitter’s coverage area in square inches. The result is in inches per hour, the same unit as rainfall depth, making it directly comparable to soil infiltration rates.
Conclusion
Drip irrigation run time is not a single number to be looked up in a chart. It is a calculation that must account for emitter output, spacing geometry, and the physical limit of how fast your specific soil can accept water. The formula is straightforward; the common error is treating the output as a controller-ready number without checking it against soil infiltration capacity first. For clay soils in particular, the raw run time output is never a valid continuous schedule. It is always a total that must be distributed across multiple short cycles separated by soak pauses long enough for the soil to process what was already delivered.
The single most consequential mistake in drip scheduling is running clay zones continuously while assuming the emitters are “doing their job slowly and gently.” The water may be moving slowly, but if it exceeds the soil’s acceptance rate, it still puddles, runs off, and fails to reach the root zone. Use the Cycle and Soak output this tool generates, install a 150-mesh filter and a 25 PSI regulator, and confirm that your drip lines are flowing at full design velocity with a drip tape flush velocity check before treating any calculated schedule as final.
Lead Data Architect
Umer Hayiat
Founder & Lead Data Architect at TheYieldGrid. I bridge the gap between complex agronomic data and practical growing, transforming verified agricultural science into accessible, mathematically precise tools and guides for serious growers.
View all tools & guides by Umer Hayiat →


