Electricity is one of the few input costs in a grow room that compounds invisibly. A 600-watt fixture running 18 hours a day looks affordable at roughly $1.51 per day, but that number becomes $45 per month and nearly $550 per year before a single harvest is complete. The error growers make is evaluating light purchases at the fixture level rather than the operational-cost level, which means the true cost of a lighting system never gets compared against yield targets or energy budgets.
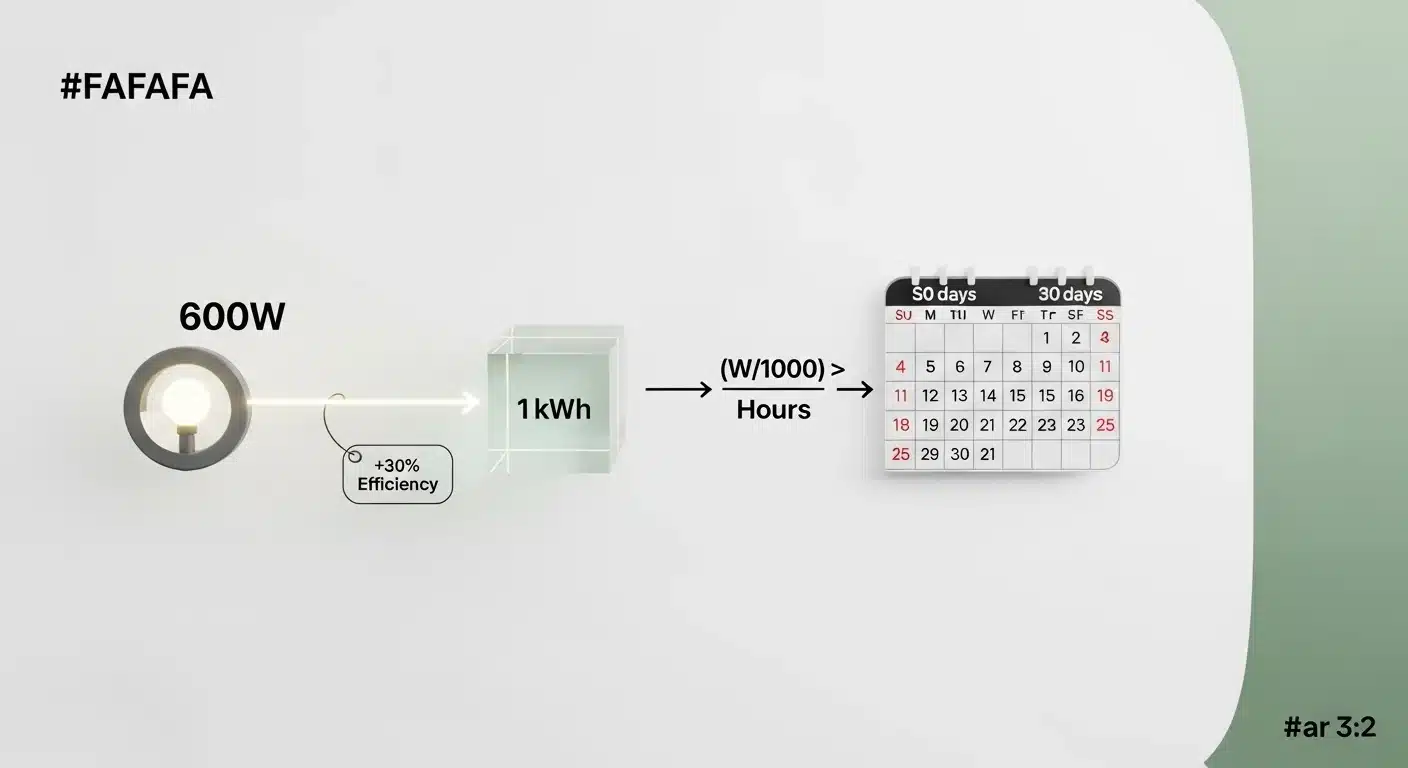
This grow light electricity cost calculator takes three inputs, wattage, daily run hours, and your local utility rate, and returns a precise daily cost and a 30-day monthly cost based on the formula Cost = (W / 1000) × Hours × Rate. It does not model tiered utility pricing, ballast efficiency losses, or the heat load added to HVAC. Those are real variables; they are outside this tool’s scope and documented in the Assumptions and Limits section below.
After using this tool, you will know whether your current lighting setup fits your monthly electricity budget, and you will have a concrete number to use when comparing an LED upgrade against your existing HPS or fluorescent system.
Use the Tool
| Light Type | Watts | $/Day | $/Month | |||||||||||||||||||||||||||||||||||||||||||||||||||||||||||||||||||||||||||||||||||||||||||
|---|---|---|---|---|---|---|---|---|---|---|---|---|---|---|---|---|---|---|---|---|---|---|---|---|---|---|---|---|---|---|---|---|---|---|---|---|---|---|---|---|---|---|---|---|---|---|---|---|---|---|---|---|---|---|---|---|---|---|---|---|---|---|---|---|---|---|---|---|---|---|---|---|---|---|---|---|---|---|---|---|---|---|---|---|---|---|---|---|---|---|---|---|---|---|
| Small LED Panel | 100 W | $0.25 | $7.56 | |||||||||||||||||||||||||||||||||||||||||||||||||||||||||||||||||||||||||||||||||||||||||||
| Mid LED Grow | 300 W | $0.76 | $22.68 | |||||||||||||||||||||||||||||||||||||||||||||||||||||||||||||||||||||||||||||||||||||||||||
| Field | Unit | What It Means | Common Mistake | Safe Entry Guidance |
|---|---|---|---|---|
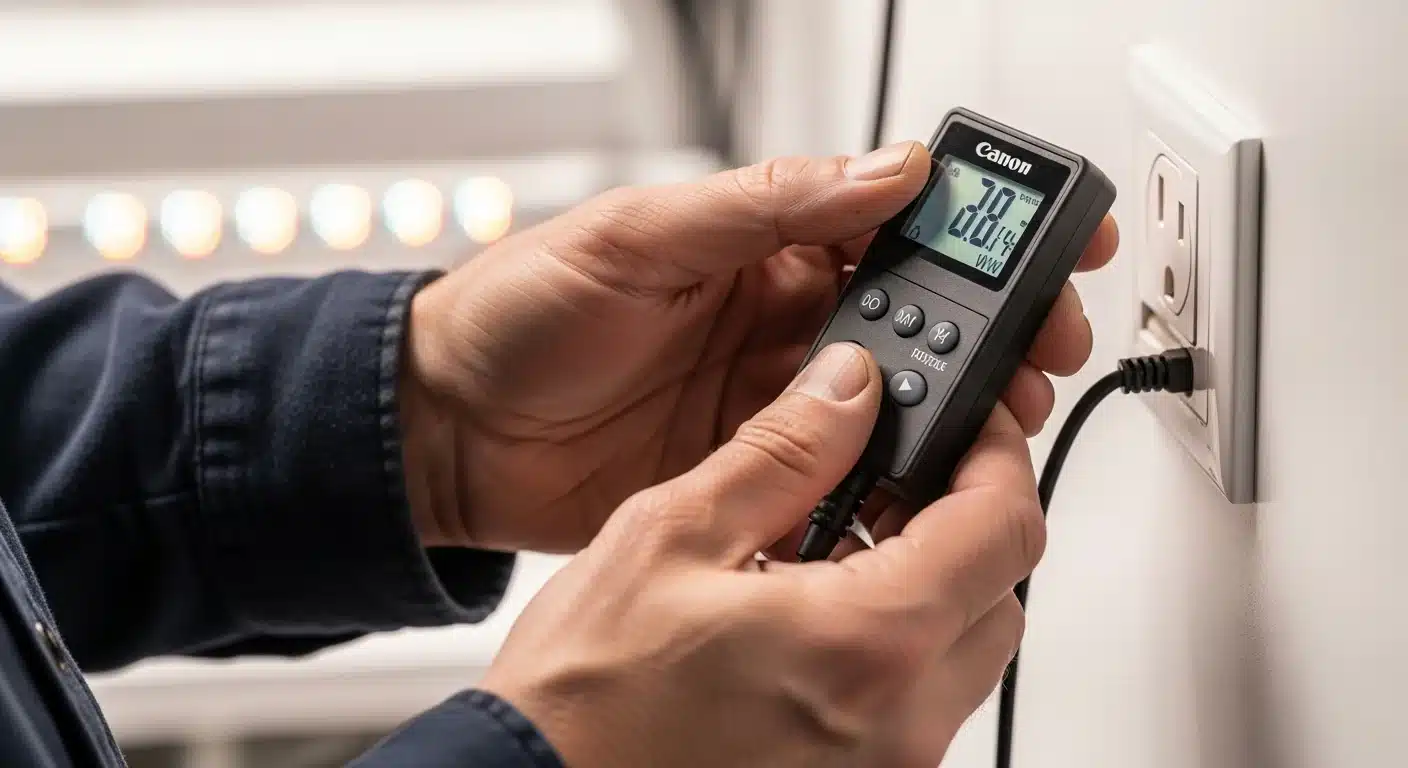
| Wattage | Watts (W) | Total electrical power the fixture draws from the wall under normal operating conditions | Entering the "equivalent" or "output" wattage from marketing copy rather than the actual input draw | Check the fixture's CE or UL label; use a plug-in power meter for the most accurate reading |
| Hours per Day | Hours (hr) | How long the light runs each day, from turn-on to turn-off, averaged across your lighting schedule | Using a 24-hour value because the timer "could" run all day; most plant species require a dark period | Match this to your actual programmed timer setting; decimals are accepted |
| Electricity Rate | Dollars per kWh ($/kWh) | The price your utility charges for each kilowatt-hour of electricity consumed | Using the national average when local rates are significantly higher, leading to underestimates | Pull the exact rate from your electricity bill; the default of $0.14 is a starting benchmark only |
| Daily Cost (Output) | Dollars per day ($/day) | The electricity cost for one 24-hour cycle at your entered wattage and run hours | Treating this as a fixed cost; it changes any time your photoperiod or rate changes seasonally | Recalculate when switching growth stages, which often changes run hours |
| Monthly Cost (Output) | Dollars per 30 days | Daily cost multiplied by 30, representing one billing-cycle estimate | Assuming this matches your actual electricity bill; the bill includes HVAC, fans, pumps, and other loads | Use this figure specifically to budget for the lighting portion of your total grow-room electricity load |
| Annual Cost (Output) | Dollars per year | Daily cost multiplied by 365, useful for comparing ROI between fixture types | Applying this to perennial lighting setups without accounting for seasonal photoperiod changes | Best used for stable, year-round operations or for ROI comparisons between fixture upgrades |
Worked Examples (Real Numbers)
Example 1: Small Home LED Grow Panel
- Wattage: 200 W
- Hours per day: 16
- Electricity rate: $0.14/kWh
kW = 200 / 1000 = 0.2 kW
kWh/day = 0.2 × 16 = 3.2 kWh
Cost/day = 3.2 × $0.14 = $0.448
Result: $0.45/day, $13.44/month, $163.52/year
A small LED panel running a standard vegetative photoperiod costs less than $14 per month. At this scale, electricity is not the dominant expense, but the calculation becomes critical when scaling to multiple fixtures in the same room.
Example 2: Standard 600-Watt HPS Flowering Setup
- Wattage: 600 W
- Hours per day: 18
- Electricity rate: $0.14/kWh
kW = 600 / 1000 = 0.6 kW
kWh/day = 0.6 × 18 = 10.8 kWh
Cost/day = 10.8 × $0.14 = $1.512
Result: $1.51/day, $45.36/month, $551.88/year
The 600-watt HPS remains a benchmark fixture in small-scale production. At $45 per month for lighting alone, a grower modeling a complete grow room must add HVAC, fans, pumps, and other equipment costs on top of this figure to get an accurate operational picture.
Example 3: Commercial LED Bar at Higher Utility Rate
- Wattage: 1,000 W
- Hours per day: 20
- Electricity rate: $0.18/kWh (higher-cost utility region)
kW = 1000 / 1000 = 1.0 kW
kWh/day = 1.0 × 20 = 20.0 kWh
Cost/day = 20.0 × $0.18 = $3.60
Result: $3.60/day, $108.00/month, $1,314.00/year
When a rate of $0.18/kWh replaces the national average, monthly costs for a single 1,000-watt fixture cross $100. This triggers the calculator's built-in warning, and it is precisely the threshold where evaluating an LED system with higher initial cost but lower wattage becomes financially justified.
Reference Table (Fast Lookup)
All values calculated at 18 hours per day and $0.14/kWh. The "Annual Cost" column is the derived value: daily cost × 365.
| Light Type | Watts | kWh per Day | Cost per Day | Cost per Month | Cost per Year (Derived) |
|---|---|---|---|---|---|
| Seedling / Clone LED | 45 W | 0.81 | $0.11 | $3.40 | $40.79 |
| Small LED Panel | 100 W | 1.80 | $0.25 | $7.56 | $91.25 |
| Mid-Range LED Grow | 250 W | 4.50 | $0.63 | $18.90 | $229.95 |
| Standard HPS 400W | 400 W | 7.20 | $1.01 | $30.24 | $368.65 |
| HID / HPS 600W (Common) | 600 W | 10.80 | $1.51 | $45.36 | $551.15 |
| LED Bar 800W | 800 W | 14.40 | $2.02 | $60.48 | $737.30 |
| DE HPS 1000W | 1,000 W | 18.00 | $2.52 | $75.60 | $919.80 |
| Commercial LED 2000W | 2,000 W | 36.00 | $5.04 | $151.20 | $1,839.60 |
| Commercial Array 4000W | 4,000 W | 72.00 | $10.08 | $302.40 | $3,679.20 |
How the Calculation Works (Formula + Assumptions)

Show the calculation steps
The formula is: Cost = (Watts / 1000) × Hours/Day × Rate ($/kWh)
Step 1 – Convert watts to kilowatts: Electricity billing uses kilowatts, not watts. Divide the wattage by 1,000. A 600-watt fixture becomes 0.6 kW.
Step 2 – Calculate daily energy consumption: Multiply kilowatts by the number of hours the fixture runs. 0.6 kW × 18 hours = 10.8 kWh per day.
Step 3 – Calculate daily cost: Multiply kWh/day by your electricity rate. 10.8 kWh × $0.14 = $1.512 per day. Results are displayed to four decimal places for precision at low wattages.
Step 4 – Calculate monthly cost: Daily cost × 30 days = monthly cost. This is a flat 30-day month, not a calendar-month average.
Rounding: Daily costs display to four decimal places. Monthly costs display to two decimal places (nearest cent). The intermediate kWh value is not rounded, preserving accuracy through each step.
Unit conversions used: 1 kW = 1,000 W. No temperature, pressure, or flow conversions are involved.
Assumptions and Limits
- The calculation assumes continuous, uninterrupted operation at the stated wattage for the full duration of the photoperiod. Dimming, duty cycling, or variable-output fixtures will draw less than their rated wattage and must have their actual draw measured at the wall.
- HID, HPS, and CMH fixtures include a ballast that consumes additional power beyond the bulb's rated wattage. This tool does not automatically add a ballast overhead. Enter the total system draw, not just the bulb wattage.
- The monthly cost figure uses a fixed 30-day month. Actual utility billing cycles vary and may span 28 to 33 days depending on the provider.
- The rate field accepts a single flat rate. Tiered utility pricing, time-of-use rates, and demand charges are not modeled. Growers on tiered plans may pay a higher marginal rate once a baseline threshold is crossed.
- Heat generated by grow lights adds to the cooling load of the space. The electricity cost of running HVAC to offset that heat is entirely separate and is not included in this calculation. For a sizing reference, see the grow room AC sizing guide.
- Wattage must be between 1 W and 50,000 W. Hours must fall between 0.1 and 24. Rate must be between $0.001 and $10.00/kWh. Inputs outside these ranges will return a validation error rather than a result.
- This tool calculates operating electricity cost only. It does not include fixture purchase price, bulb replacement intervals, driver or ballast replacement, or depreciation, all of which factor into total cost of ownership.
Standards, Safety Checks, and "Secret Sauce" Warnings
Critical Warnings
- The daily cost alone is a misleading figure for budgeting. The 30-day monthly cost is the number that belongs in an operating budget, because it aligns with billing cycles, lease terms, and monthly cash flow. A daily figure of $1.51 reads as trivial; the same number compounded to $45.36 per month and $551 per year changes the evaluation entirely.
- Using the $0.14/kWh default when your actual rate is $0.22/kWh or higher will understate your costs by a significant margin. Always pull the exact rate from your electricity bill before treating the result as final. Rates in California, Massachusetts, Hawaii, and several other states are consistently above $0.20/kWh.
- Any fixture exceeding 1,500 watts requires a verified circuit capacity check before installation. This tool will display a warning at that threshold, but the calculation itself will still return a cost estimate. A circuit warning in the tool is not a substitute for an electrician's assessment.
Minimum Standards
- The U.S. residential average electricity rate is $0.14/kWh based on EIA 2024 data. Use this only as a comparison baseline, not as a substitute for your actual rate.
- A photoperiod of fewer than six hours per day is flagged by the calculator because it falls below the light threshold most plant species require to maintain vegetative growth or meaningful photosynthesis. Twelve to eighteen hours per day is the standard range for most indoor crops.
- Operating grow lights at exactly 24 hours per day will generate a warning. Most crops, including high-value flowering plants, require a defined dark period. Eliminating the dark period does not reduce electricity costs and can impair plant hormone cycles.
Competitor Trap: Most grow light cost calculators return only a daily or annual electricity figure and call it complete. The missing output is the monthly cost, which is the unit growers actually use for budgeting and for comparing the operational economics of one fixture type against another. A tool that skips the 30-day number forces the user to do a manual multiplication step, introduces rounding errors, and makes it impossible to directly compare the calculator's output to a utility bill. The monthly cost field is not a convenience; it is a decision-making requirement.
Grow lights add a substantial heat load to any enclosed space. High-output fixtures in a sealed environment can push temperatures beyond the optimal range for most crops, which means the HVAC load increases in direct proportion to lighting wattage. The grow room dehumidifier calculator addresses one aspect of that climate management challenge, since humidity and temperature are coupled variables in enclosed grow spaces.
Common Mistakes and Fixes
Mistake: Entering the Fixture's Marketing Wattage Instead of Actual Draw
LED grow lights are frequently marketed by their "equivalent" wattage, a comparison to older HID technology rather than a measurement of actual power consumption. A fixture described as "1000W equivalent" may draw only 200 to 400 actual watts from the wall. Entering the marketing wattage produces a cost estimate that is two to five times too high, making efficient LED systems appear far more expensive than they are.
Fix: Measure wall draw directly with a plug-in power meter, or find the "actual power draw" figure in the fixture's technical specifications, not the headline marketing number.
Mistake: Applying a Single Rate to a Tiered Electricity Plan
Many residential utilities charge a lower rate for the first block of monthly consumption and a higher marginal rate beyond a usage threshold. Grow operations often push households into higher tiers because the lighting load adds substantially to baseline residential consumption. Using the first-tier rate understates the true cost of the incremental kWh that the grow lights add to the bill.
Fix: Identify the tier your current monthly consumption falls into, and enter the marginal rate that applies to the additional grow-light kWh, not your average blended rate.
Mistake: Ignoring Seasonal Photoperiod Changes
A grower running 18 hours per day in vegetative stage and 12 hours per day in flowering stage will have two different cost profiles for the same fixture. Calculating a single annual cost using only one photoperiod overstates or understates the actual annual spend depending on which stage dominates the growing calendar.
Fix: Run the calculator separately for each growth stage photoperiod, then weight each result by the number of days spent in that stage to build a more accurate annual cost model.
Mistake: Treating the Lighting Cost as the Total Electricity Cost
In a typical enclosed grow room, lighting is one load among many. Fans, pumps, controllers, HVAC units, and CO2 equipment all draw power. Presenting the grow light electricity cost to a business partner or landlord as the total energy cost of the operation significantly underrepresents the actual draw.
Fix: Use this calculator for the lighting component, then calculate each additional load separately and sum them. The greenhouse fan calculator can help size and cost the ventilation load as a separate line item.
Mistake: Not Recalculating When Switching Fixture Types
Growers who upgrade from HPS to LED often continue quoting the old fixture's electricity cost when discussing their operation. LED fixtures of equivalent light output typically draw 40 to 60 fewer watts than the HPS systems they replace, but this advantage only shows up in the budget if the calculation is actually run on the new hardware.
Fix: Re-enter the new fixture's actual wattage every time a fixture is upgraded or replaced. The cost difference is often substantial enough to affect ROI timelines for the equipment investment.
Next Steps in Your Workflow
Once you have your lighting electricity cost in hand, the natural next question is whether your current photoperiod is delivering the light accumulation your crops actually need, or whether you could shorten the run time and reduce costs without hurting yield. The DLI calculator works alongside this tool: it takes your fixture's light output and your run hours and returns the daily light integral your plants are receiving, which tells you whether hours can be cut or whether the opposite problem exists and plants are light-starved.
The second priority after lighting cost is understanding the full climate load that lighting creates. High-wattage fixtures generate heat that your cooling and ventilation systems must offset, which adds to your total electricity draw beyond what this calculator returns. For that next step in your grow room energy audit, the grow tent fan size calculator helps translate your lighting wattage and canopy conditions into an accurate airflow requirement for keeping temperatures within range.
FAQ
How do I find my electricity rate?
Your electricity rate is listed on your utility bill, usually labeled as "energy charge," "rate per kWh," or "unit price." Avoid using the average calculated by dividing your total bill by total kWh, since that average blends in fixed charges and fees. Find the actual per-kWh rate in the rate schedule section of your statement, or look up your utility's current published rate online.
Does the calculator account for LED driver efficiency losses?
No. The calculator uses the wattage you enter as the total system draw. If your LED driver has efficiency losses, meaning the driver consumes more power than the LEDs themselves use, that additional draw is only captured if you measure and enter total wall draw rather than the LED chip wattage. Use a plug-in watt meter to get the most accurate number for the wall rather than relying on driver or LED specifications alone.
Why does the monthly cost use 30 days instead of the actual month length?
A fixed 30-day month produces a consistent, comparable figure across different months and simplifies budget planning. Utility billing cycles do not always align with calendar months either, so a 30-day baseline is a practical standard for comparing costs across scenarios. If your billing cycle is 31 days, multiply the daily cost figure by your actual cycle length for a more precise bill estimate.
What wattage should I enter for a dual-ended HPS fixture?
Enter the total system wattage including the ballast, not just the lamp rating. A 1,000-watt DE HPS lamp typically operates with a ballast that draws 1,030 to 1,080 watts total from the wall. Check the ballast label or specification sheet for the actual input power draw, and enter that figure. Using only the lamp wattage will understate the cost for HID systems.
Can I use this calculator for multiple lights in the same room?
Yes. Add the wattages of all fixtures together and enter the combined total in the wattage field. The calculator returns the electricity cost for the entire system at that total draw. If different fixtures run different photoperiods, calculate each group separately using its own wattage and run-time combination, then add the daily cost results together manually.
How accurate is the indoor plant light cost result for greenhouse growers?
The calculation is accurate for any fixture running at a known wattage and fixed daily schedule, including greenhouse supplemental lighting. The input to watch carefully in a greenhouse context is hours per day: supplemental lighting hours should represent only the artificial light portion of the photoperiod, not total daylength. Entering total daylength including natural daylight will overstate the time the fixture is actually energized and produce an inflated cost estimate.
Conclusion
The grow light electricity cost calculation is straightforward, but the decision it supports is not. Understanding both the daily and monthly cost figures, rather than relying on either one alone, is what separates an accurate operating budget from a rough guess. The 30-day monthly number is the figure that belongs in a cost analysis, a lease negotiation, or an LED upgrade ROI spreadsheet. Daily figures are useful for cross-checking math; monthly figures are useful for making decisions.
The most common error that undermines this calculation is entering marketing wattage rather than actual wall draw. For HID systems this understates the true draw; for LED systems it frequently overstates it by a wide margin. Measure at the wall whenever possible. Once you have an accurate lighting cost established, the rest of your grow room energy audit can follow: for a complete picture, the VPD calculator addresses the climate side of your environment and helps clarify how lighting-generated heat interacts with your humidity targets across growth stages.
Lead Data Architect
Umer Hayiat
Founder & Lead Data Architect at TheYieldGrid. I bridge the gap between complex agronomic data and practical growing, transforming verified agricultural science into accessible, mathematically precise tools and guides for serious growers.
View all tools & guides by Umer Hayiat →
Hydrangea Pruning: Match Your Cuts to Bloom Wood Type for Reliable Flowers Every Year
The real difference between hydrangeas that bloom year after year and those that skip a season comes down to one decision: does your plant set its flower…

Spring Bulbs Decision Grid: 9 Naturalizing Varieties for Multi-Year Color in Your Garden
Spring bulbs deliver the most value when selected for their ability to naturalize and multiply in place rather than serving as one-season displays that fa…

Cut Flower Garden: 12 Plants That Regenerate After Every Harvest
A cut flower garden succeeds when every stem you cut triggers new growth from side shoots or the base rather than ending the plant’s season. Most recommen…

Butterfly Flowers: The Yield Grid Decision Grid for Choosing Plants That Match Your Conditions
Butterfly flowers deliver consistent visitors only when selected through a conditions-based grid rather than popularity rankings that overlook invasivenes…
