
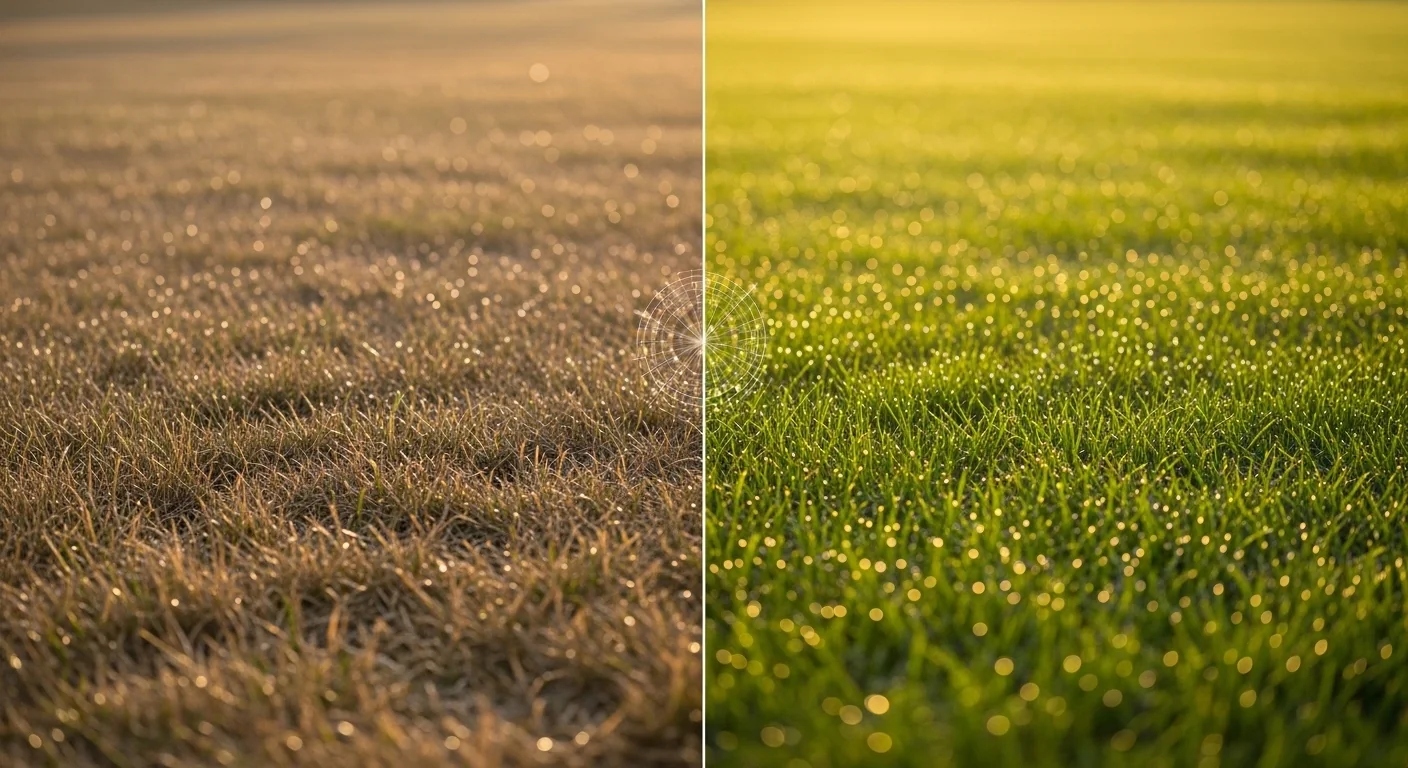
A rain sensor that shuts off your irrigation system is doing its job. A rain sensor that keeps it off for three days while air temperatures hit 95°F and winds blow at 15 mph is silently killing your turf. These two situations look identical from the outside: the controller light is on, the system is paused, and the lawn appears fine. The failure only becomes visible when the grass starts browning mid-week despite adequate rainfall over the weekend.
This calculator computes the estimated dry-out time for a physical rain sensor by cross-referencing its water-retention setpoint against the actual evapotranspiration (ET) rate and current wind speed. It does not predict soil moisture, forecast rainfall probability, or replace a full irrigation audit. What it does is give you a single, actionable number: how many hours your system will stay locked out, and whether that window is safe for your current ET environment. For a precise local ET figure to plug in, the evapotranspiration calculator on this site can help you derive a daily rate from temperature, humidity, and solar radiation inputs.
If the calculator returns a dry-out time above 48 hours during any period where your daily ET exceeds 0.12 inches per day, you have a Phantom Drought configuration and need to either adjust the sensor’s vent ring, lower the setpoint, or upgrade to a smart controller with real-time ET bypass.
Use the Tool
Smart Controller: Rain Sensor Dry-Out Calculator
Prevent “Phantom Drought” — match your sensor’s dry-out time to real-world ET demand
⚠️ Warnings & Standards Check
| ET Rate (in/day) | Dry-Out Time (hrs) | Wind Factor | Status |
|---|
💡 Upgrade Recommendation
Based on your inputs, consider upgrading your irrigation system components for better performance.
📐 How This Calculator Works
The “Phantom Drought” Problem: A cheap rain sensor cork physically takes days to dry even if atmospheric demand (ET) is extreme. If ET is very high (hot, dry, windy day), your lawn may need water within 24 hours of rain — but if the sensor stays locked off for 72 hours, the lawn dies of drought despite a working system.
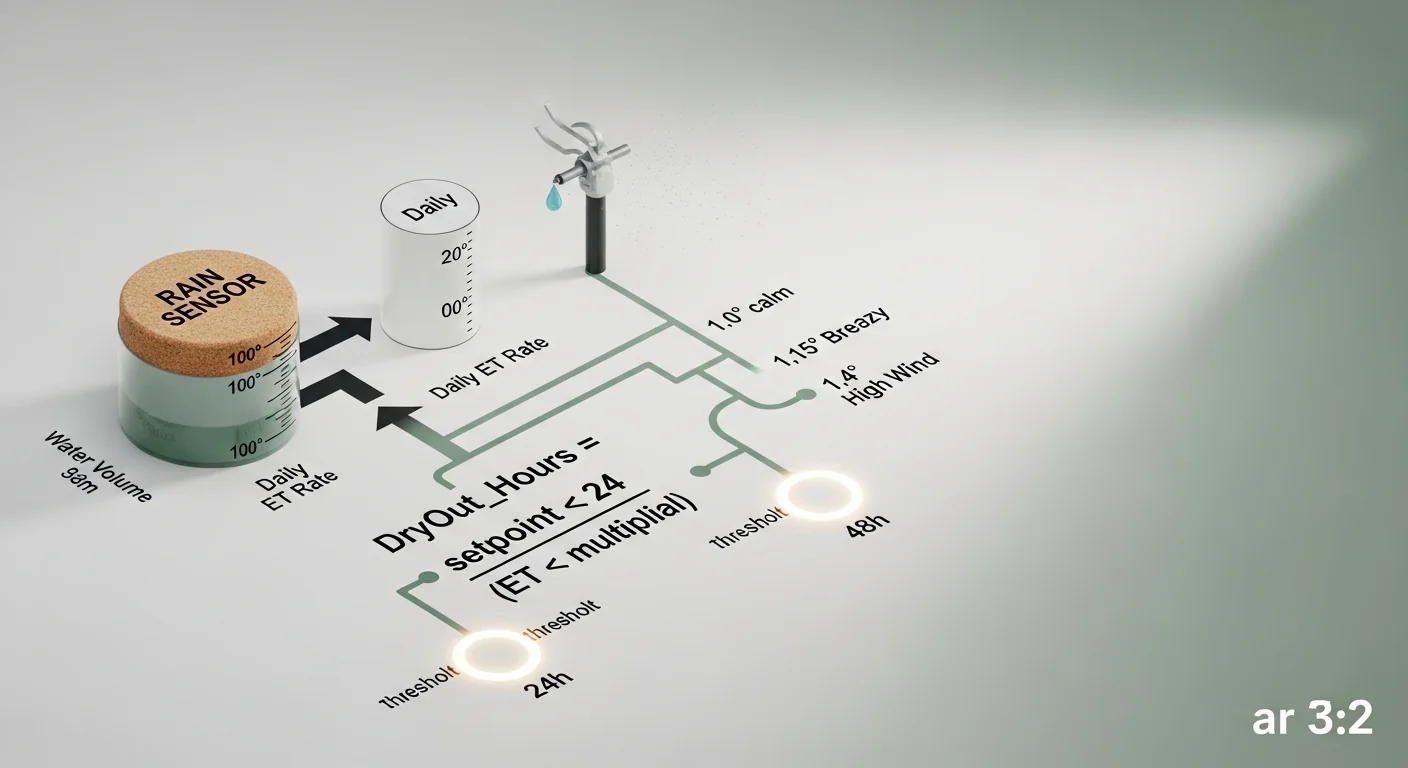
Step 1 — Evaporation Multiplier: Wind accelerates surface drying. At >12 mph, we apply a 1.4× wind multiplier; at 6–12 mph, 1.15×; below 6 mph, 1.0×.
Step 2 — Dry-Out Hours: The physical volume of water that the sensor cork holds (setpoint) divided by the adjusted ET rate. Soil infiltration rate is used to flag whether deep percolation will carry water away before ET removes it.
Step 3 — Safety Checks:
- If DryOut_Hours > 48h → FAIL: High Phantom Drought risk (plant wilting threshold)
- If DryOut_Hours 24–48h → WARN: Marginal; monitor conditions
- If Wind > 12 mph → Pause irrigation: wind drift wastes 20–30% of applied water
- If Infiltration < 0.15 in/hr (clay) → Warn: runoff/pooling risk
📋 Assumptions & Limits
- ET values sourced from ASCE Penman-Monteith standard method; consult local CIMIS/NOAA data for precision.
- Plant wilting threshold assumed at 48 hours for warm-season turf (Bermuda, Zoysia). Cool-season grasses (Fescue, Bluegrass) may be slightly more tolerant.
- Wind multiplier is a simplified field factor; ultrasonic anemometer data (not hand-held estimates) is preferred for certified irrigation scheduling.
- Sensor cork dry-out is temperature-dependent — extreme heat (>95°F) accelerates physical cork drying independent of ET.
- Soil infiltration flag is advisory only; a full infiltration test (double-ring infiltrometer) is recommended for clay or compacted soils.
- This calculator does not account for canopy interception, slope runoff, or sensor brand-specific vent ring settings.
- For professional irrigation design, follow ASABE S526 and SWAT best management practices.
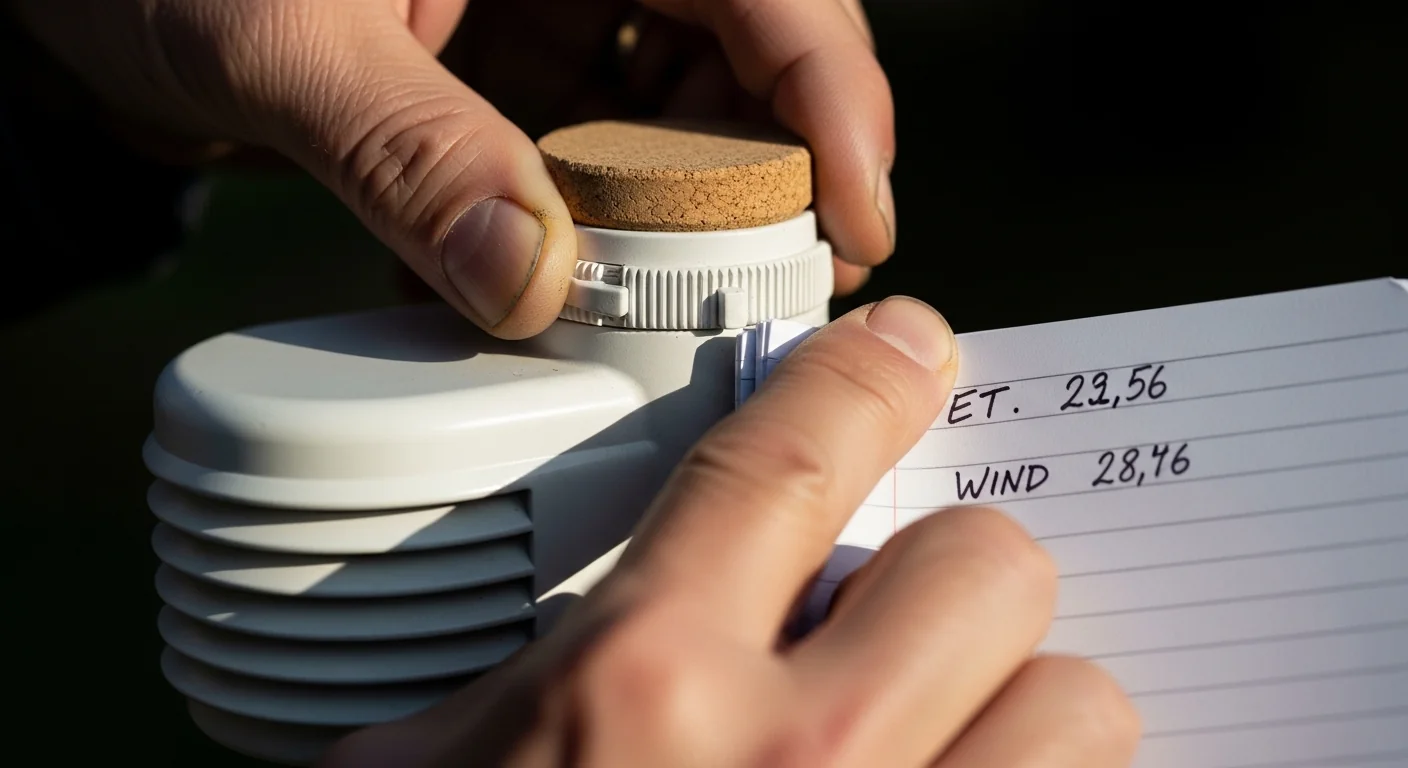
Before you calculate, have four numbers ready: your rain sensor’s water-retention setpoint in inches (printed on the sensor dial or in the manufacturer spec sheet), the average daily ET for your current month in inches per day, your soil’s infiltration rate in inches per hour, and the current or average wind speed in mph. If you are unsure of your soil infiltration rate, the soil infiltration rate calculator provides a method for estimating it from texture and compaction data. Enter all four values, then click Calculate Dry-Out Time.
Quick Start (60 Seconds)
- Rain Sensor Setpoint (in): This is the physical dial position on your sensor, not the amount of rain that fell. Common residential settings are 0.10 in, 0.25 in, and 0.50 in. Do not confuse this with your controller’s rain delay setting, which is a time-based override entirely separate from the sensor.
- Average Daily ET (in/day): Use your local CIMIS, NOAA, or weather-station data for the current month. Do not use annual average ET; seasonal swings are large enough to shift your result from SAFE to FAIL. A value between 0.05 and 0.10 is typical for cool, overcast weather; 0.20 to 0.35 is common during peak summer heat.
- Soil Infiltration Rate (in/hr): Sandy loam accepts 0.4 to 0.8 in/hr; standard loam accepts 0.3 to 0.5 in/hr; clay soils can drop below 0.15 in/hr. If you do not know your soil type, enter a conservative 0.30 in/hr as a starting point.
- Wind Speed (mph): Use current conditions or a daily average. The calculator applies a 1.0x multiplier below 6 mph, 1.15x from 6 to 12 mph, and 1.4x above 12 mph. Wind matters: it accelerates surface moisture loss from the sensor cork and from your turf simultaneously.
- Do not guess the ET value. Using a number that is even 50% too low will make a FAIL scenario appear as a SAFE one. When in doubt, round up.
- Use the reference table in the results to check how your sensor would perform across the full range of monthly ET values, not just today’s figure.
- Run the calculator again in a different season. A setting that is safe in October can be a Phantom Drought trigger in July for the same lawn.
Inputs and Outputs (What Each Field Means)
| Field | Unit | What It Represents | Common Mistake | Safe Entry Guidance |
|---|---|---|---|---|
| Rain Sensor Setpoint | inches | The water depth the sensor’s cork disc must lose before allowing irrigation to resume. Set by the vent ring position on the sensor housing. | Entering the rainfall amount instead of the dial position. | Read directly from the sensor dial or product spec sheet. Common values: 0.10, 0.25, 0.50 in. |
| Average Daily ET | in/day | Evapotranspiration: the combined rate at which soil moisture evaporates and plants transpire, measured or estimated for the current month. | Using annual average ET instead of the peak-month value, which can be three to four times lower. | Source from CIMIS (California), NOAA, or your smart controller’s weather feed. Use the monthly figure, not annual. |
| Soil Infiltration Rate | in/hr | The rate at which water enters the soil. Used to flag runoff risk and cycle-and-soak scheduling needs. It does not change the primary dry-out calculation but triggers a warning below 0.15 in/hr. | Assuming loam values for clay-heavy or compacted soil, leading to overwatering and pooling. | Sandy: 0.8 to 2.0 in/hr. Loam: 0.3 to 0.6 in/hr. Clay: 0.05 to 0.15 in/hr. |
| Wind Speed | mph | Current or average daily wind speed. Drives the evaporation multiplier applied to the ET rate for the sensor dry-out formula, and triggers a drift pause warning above 12 mph. | Leaving this at 0 when conditions are breezy, which understates dry-out time and produces an overly optimistic result. | Check a weather app or on-site sensor. Even a steady 8 mph wind increases effective ET by 15%. |
| Dry-Out Time (output) | hours | The estimated number of hours the sensor will keep the irrigation system locked off after a rain event, given current ET and wind conditions. | Treating this as exact. It is an estimate; actual cork dry-out also depends on temperature, humidity, and sensor orientation. | Compare against the 24-hour and 48-hour thresholds shown in the results gauge. |
Worked Examples (Real Numbers)
Scenario 1: Hot Summer Day, High Wind, Low Setpoint
- Rain Sensor Setpoint: 0.25 in
- Average Daily ET: 0.25 in/day
- Soil Infiltration Rate: 0.45 in/hr (loam)
- Wind Speed: 15 mph (above 12 mph threshold)
Result: 17.1 hours (SAFE)
With high summer ET and strong wind, the evaporation multiplier rises to 1.4x. The sensor’s small water volume clears in under 18 hours, well ahead of the 24-hour advisory mark. The wind drift warning still fires because 15 mph exceeds the safe irrigation threshold, meaning the system should not run until winds drop regardless of sensor status.
Scenario 2: Mild Spring Weather, Large Setpoint, Calm Conditions
- Rain Sensor Setpoint: 0.50 in
- Average Daily ET: 0.08 in/day
- Soil Infiltration Rate: 0.30 in/hr (loam)
- Wind Speed: 4 mph (calm)
Result: 150.0 hours (FAIL)
This is the classic Phantom Drought setup. A half-inch setpoint combined with low spring ET and no wind means the cork holds moisture for over six days. Turf damage from drought stress occurs well before the sensor clears. Reducing the setpoint to 0.10 in under these conditions drops dry-out time to 30 hours.
Scenario 3: Suburban Default, Moderate ET, Breezy
- Rain Sensor Setpoint: 0.25 in
- Average Daily ET: 0.15 in/day
- Soil Infiltration Rate: 0.35 in/hr (loam)
- Wind Speed: 8 mph (breezy, multiplier 1.15x)
Result: 34.8 hours (CAUTION)
This is the most common residential scenario. The result lands in the 24-to-48-hour marginal zone. For cool-season grasses like Tall Fescue, this is generally acceptable. For Bermuda or Zoysia in a heat spell, it edges toward risk. Increasing vent ring airflow on the sensor or switching to a 0.10 in setpoint brings this into the SAFE zone.
Reference Table (Fast Lookup)
All values assume a 0.25 in sensor setpoint. The “Effective ET” column reflects the ET value after applying the wind multiplier (Calm=1.0x, Breezy=1.15x, High=1.4x).
| ET Rate (in/day) | Wind Condition | Wind Multiplier | Effective ET (in/day) | Dry-Out Time (hrs) | Status |
|---|---|---|---|---|---|
| 0.05 | Calm (<6 mph) | 1.0x | 0.050 | 120.0 | FAIL |
| 0.08 | Calm (<6 mph) | 1.0x | 0.080 | 75.0 | FAIL |
| 0.10 | Calm (<6 mph) | 1.0x | 0.100 | 60.0 | FAIL |
| 0.12 | Breezy (6-12 mph) | 1.15x | 0.138 | 43.5 | CAUTION |
| 0.15 | Breezy (6-12 mph) | 1.15x | 0.173 | 34.8 | CAUTION |
| 0.18 | Breezy (6-12 mph) | 1.15x | 0.207 | 29.0 | CAUTION |
| 0.20 | High (>12 mph) | 1.4x | 0.280 | 21.4 | SAFE |
| 0.25 | High (>12 mph) | 1.4x | 0.350 | 17.1 | SAFE |
| 0.30 | High (>12 mph) | 1.4x | 0.420 | 14.3 | SAFE |
| 0.35 | High (>12 mph) | 1.4x | 0.490 | 12.2 | SAFE |
The inverse pattern is the core lesson: conditions that produce the highest drought risk for turf (low ET, calm air) are exactly the conditions that produce the longest sensor lockout times.
How the Calculation Works (Formula + Assumptions)
Show the calculation steps
Step 1: Determine the Wind Evaporation Multiplier
Wind increases the rate at which surface moisture, including the moisture held in the sensor’s cork disc, evaporates. The calculator applies a stepped multiplier:
- 0 to 5 mph (calm): multiplier = 1.0
- 6 to 12 mph (breezy): multiplier = 1.15
- Above 12 mph (high wind): multiplier = 1.4
Step 2: Calculate Dry-Out Hours
The sensor’s setpoint in inches represents the volume of water the cork disc must lose before the sensor switch resets. The daily ET rate (in inches per day) is converted to an hourly rate by dividing by 24, then adjusted by the wind multiplier:
DryOut_Hours = Sensor_Setpoint_in x 24 / (DailyET_in_per_day x WindMultiplier)
Example: 0.25 in setpoint, 0.15 in/day ET, 1.15 wind multiplier:
DryOut = 0.25 x 24 / (0.15 x 1.15) = 6.0 / 0.1725 = 34.8 hours (CAUTION)
Step 3: Apply Threshold Checks
- Below 24 hours: SAFE (sensor clears well before plant stress threshold)
- 24 to 48 hours: CAUTION (marginal; acceptable for some grass types and mild conditions)
- Above 48 hours: FAIL (exceeds the warm-season turf wilting reference threshold)
- Wind above 12 mph: Drift pause warning fires regardless of dry-out result
- Infiltration below 0.15 in/hr: Clay/runoff advisory fires
Rounding: Dry-out hours are displayed to one decimal place. Internal calculations use full floating-point precision.
Assumptions and Limits
- The formula treats the sensor cork as a simple reservoir that loses moisture at a rate proportional to ET, adjusted linearly by the wind multiplier. Real cork dry-out is also affected by ambient temperature, direct solar radiation on the sensor housing, and humidity, none of which are modeled here.
- The 48-hour wilting threshold is a reference value for warm-season turf (Bermuda grass, Zoysia). Cool-season grasses (Tall Fescue, Kentucky Bluegrass) may tolerate 60 to 72 hours before visible stress, especially in mild temperatures.
- Wind multipliers (1.0, 1.15, 1.4) are simplified engineering factors. They are not derived from a specific sensor brand’s empirical data. Actual multipliers vary by sensor model, vent ring position, and housing orientation relative to prevailing winds.
- ET values from CIMIS or NOAA represent area-averaged, reference ET (ETo) for short grass. Actual crop or turf ET depends on the crop coefficient (Kc), which varies by grass species and growth stage.
- Soil infiltration rate is used only for advisory flagging in this calculator. It does not alter the dry-out time output. For full irrigation scheduling, matched precipitation rate matters more than raw infiltration; the matched precipitation rate calculator addresses that relationship directly.
- The calculator does not account for sensor age, cork degradation, or vent ring obstruction (dust, debris, scale buildup), all of which can dramatically increase actual dry-out time beyond what the formula predicts.
- Results are estimates for decision support. They are not a substitute for an irrigation audit performed by a certified irrigation professional (CIC or CLIA credential).
Standards, Safety Checks, and “Secret Sauce” Warnings
Critical Warnings
- The Phantom Drought trap is invisible: The controller’s status light shows “sensor active” with no error code. Without calculating dry-out time against local ET, there is no way to know the system is causing drought stress rather than preventing it. This failure mode is responsible for unexplained turf loss in the days following rain events.
- High-ET weather correlates with long sensor lockouts under common setpoint configurations. A 95°F day with low humidity (peak ET) should produce the fastest dry-out. But if your wind is calm and your setpoint is 0.50 in, the cork can still lock the system for 60 or more hours. Temperature does not directly drive the formula the way wind does.
- Wind drift above 12 mph wastes applied water regardless of sensor status. If the calculator shows the sensor would allow irrigation during a high-wind period, irrigation efficiency drops sharply. Scheduling should shift to calm morning windows. The formula flags this condition as a secondary check precisely because it is frequently ignored in residential scheduling.
- Vent ring position is the primary adjustment lever, not the setpoint dial. Most cheap rain sensors are installed and never adjusted. The vent ring controls airflow around the cork and is the fastest way to change dry-out behavior without replacing hardware. Fully open vent positions can cut dry-out time by 30 to 50% compared to the closed factory default.
Minimum Standards
- The SWAT (Smart Water Application Technologies) best management practices recommend that any bypass-capable rain sensor be set to the manufacturer’s lowest effective setpoint (typically 0.10 in) in climates with average summer ET above 0.20 in/day.
- ASABE standard S526 (sensor performance for irrigation scheduling) requires that bypass mechanisms re-enable the irrigation controller within a timeframe consistent with local crop water demand. For residential turf under common summer ET conditions, the 48-hour threshold used here is a reasonable operational interpretation of that requirement.
- Wi-Fi smart controllers certified under the EPA WaterSense program are designed to override physical sensor lock-out conditions based on real-time ET data, meeting the intent of S526 without relying on physical cork dry-out at all.
Competitor Trap: Most rain sensor guides tell you to “set the sensor to match your local rainfall.” That advice addresses sensor activation, not sensor recovery. Correctly setting the activation threshold prevents the sensor from tripping on light sprinkles. Setting the correct vent ring position and setpoint for your local ET environment determines whether the recovery time is safe or dangerous. These are two separate calibration decisions and almost all published guides, including most manufacturer installation sheets, only discuss the first one.
Common Mistakes and Fixes
Mistake: Setting the Setpoint High to Avoid False Shutoffs
Homeowners frustrated by irrigation shutoffs from minor drizzle often dial the setpoint up to 0.75 in or 1.00 in. This eliminates nuisance trips but extends the post-rain lockout to 90 or more hours in low-ET conditions. The sensor becomes permanently in recovery mode during mild, rainy weather periods. The fix is to lower the setpoint to 0.10 or 0.25 in and instead adjust the vent ring to allow faster dry-out, which addresses both nuisance trips and Phantom Drought simultaneously.
Mistake: Treating the Rain Sensor as a Set-and-Forget Device
Physical rain sensors are installed once, often by a contractor, and are never recalibrated for seasonal ET changes. A setting that works safely in August can lock the system for five or more days after a rain in March when ET is a fraction of peak summer values. Revisit the dry-out calculation at minimum for your highest-ET month and your lowest-ET month, and consider adjusting the vent ring between seasons. The irrigation catch-can test calculator is useful for verifying application rates once the system is back online after a lockout event.
Mistake: Ignoring Wind When Scheduling After a Sensor Clears
Once the sensor clears, many controllers immediately run the next scheduled cycle regardless of current wind conditions. Irrigating at 15 mph wind creates drift losses and uneven distribution. The wind speed input in this calculator also flags this condition: if your wind speed is above 12 mph, the system should remain paused until wind drops, even after the sensor has dried out. Check your controller’s wind sensor integration or schedule irrigation for early morning hours when wind is typically calmer.
Mistake: Confusing ET Rate Sources
Using annual average ET instead of monthly ET is one of the most common data errors. Annual averages mask the seasonal extremes that cause problems. A climate with 25 inches of annual ETo might have a July daily rate of 0.30 in/day and a January rate of 0.04 in/day. Plugging the annual average into the formula produces a result that is dangerously wrong in both directions. Always use the monthly figure from a source like CIMIS, NOAA Evapotranspiration grids, or your smart controller’s weather station data.
Mistake: Assuming Sensor Failure When Dry-Out Is Simply Slow
After a rain event, homeowners sometimes report that the irrigation system “isn’t working” when the sensor is simply in a slow dry-out period. This leads to manual overrides, disconnected sensors, and ultimately unprotected systems that run during and after rain events. Running this calculator before calling for service often reveals that the sensor is functioning correctly but is calibrated for a faster-drying climate than the current one. The fix is calibration, not replacement.
Next Steps in Your Workflow
After calculating your sensor’s dry-out time, the next practical step depends on your result. If the tool returns a CAUTION or FAIL status, start with the vent ring on your existing sensor before considering hardware replacement. Open the vent ring one or two positions toward its maximum airflow setting and re-run the calculation using the same inputs. If the dry-out time does not improve enough to reach a SAFE result, the sensor’s setpoint is likely too high for your local ET environment. Dropping from 0.25 in to 0.10 in cuts dry-out time proportionally across every scenario. Once the sensor is optimized, calibrating run times is the next priority; the sprinkler run time calculator can help you set runtimes that apply the right amount of water once the lockout clears.
For properties where a physical rain sensor consistently causes problems across multiple seasons, a Wi-Fi enabled smart controller with real-time ET adjustment is the engineering solution that removes the cork-based dry-out dependency entirely. These controllers query a local weather station every day and automatically reduce or skip irrigation cycles based on actual ET demand, effectively solving the Phantom Drought problem at the source. If your site uses drip irrigation rather than spray heads, the drip irrigation run time calculator provides the equivalent scheduling tool for low-volume systems after any sensor reconfiguration.
FAQ
What is rain sensor dry-out time and why does it matter?
Dry-out time is the number of hours a physical rain sensor keeps your irrigation system locked off after a rain event. It is determined by how much water the sensor’s cork disc retains relative to how fast that moisture evaporates. If dry-out time is longer than the period your turf can tolerate without irrigation, the result is drought stress even though rain recently fell. Matching dry-out time to your local evapotranspiration rate is the key calibration step most homeowners never make.
What is “Phantom Drought” in irrigation?
Phantom Drought describes the condition where turf or landscape plants die from drought stress while the irrigation system is technically functional but locked off by a rain sensor with a dry-out time that exceeds plant water demand. The plants die not from absent rain or a broken system, but from a calibration mismatch between the sensor’s physical recovery time and the atmosphere’s actual ET demand. The condition is especially common after a quick rain event followed by several hot, dry, breezy days.
What is the vent ring on a rain sensor and how does it affect dry-out?
The vent ring is an adjustable collar on the sensor body that controls airflow around the cork disc. Opening the vent ring increases air circulation, which accelerates cork drying. Closing it retains moisture longer. Most sensors ship with the vent ring in a mid-range or closed position. Adjusting to a fully open position can meaningfully reduce dry-out time without changing the sensor’s activation setpoint, offering a free calibration option before purchasing new hardware.
How is the evaporation multiplier for wind determined?
The wind multiplier in this calculator is a simplified field factor representing the acceleration of surface moisture loss at increasing wind speeds: 1.0 at calm conditions below 6 mph, 1.15 at breezy conditions between 6 and 12 mph, and 1.4 above 12 mph. These are engineering approximations. Actual sensor cork drying curves vary by sensor brand, orientation, housing design, and local humidity. Ultrasonic anemometers connected to a smart controller can provide the precision needed for certified irrigation audits.
At what wind speed should irrigation be paused?
The 12 mph threshold used in this calculator reflects a widely cited industry guideline for conventional spray and rotor irrigation systems. Above 12 mph, wind drift redistributes applied water unevenly, reducing efficiency and potentially depositing water outside the intended zone. Some professional schedulers use 10 mph as a more conservative pause threshold. Smart controllers with integrated anemometers can automate this pause condition rather than relying on manual scheduling adjustments.
Can I use this calculator for drip or micro-irrigation systems?
The dry-out time calculation applies regardless of irrigation type because it describes the sensor’s physical recovery behavior, not the application method. However, drip and micro-irrigation systems are less sensitive to wind drift, making the drift pause warning less critical for those system types. The soil infiltration flag is also less relevant for drip systems, where water is applied at or below the surface infiltration rate by design. For drip-specific scheduling parameters, separate calculations for emitter flow and runtime apply.
Conclusion
Rain sensor dry-out time is not a fixed property of your sensor. It shifts with every change in daily ET, wind speed, and vent ring position. A sensor calibrated for a mild October performs very differently in a July heat event, and that difference can mean the gap between a thriving lawn and one that browns out inexplicably three days after a rainstorm. The Phantom Drought failure mode is almost always traceable to a single root cause: the installer set the sensor’s activation threshold but never calculated whether the recovery time was appropriate for peak-season ET demand.
The single most important mistake to avoid is using a high setpoint (0.50 in or above) in any climate where summer ET exceeds 0.15 in/day. The math consistently shows that this combination produces dry-out windows of 60 to 80 hours, well past the 48-hour turf wilting reference regardless of how well the rest of the irrigation system performs. If your property is in a region with pronounced summer ET demand, the field capacity soil moisture calculator can help you understand how quickly stored soil moisture depletes during a sensor lockout period, giving you a fuller picture of actual plant stress risk.
Lead Data Architect
Umer Hayiat
Founder & Lead Data Architect at TheYieldGrid. I bridge the gap between complex agronomic data and practical growing, transforming verified agricultural science into accessible, mathematically precise tools and guides for serious growers.
View all tools & guides by Umer Hayiat →


