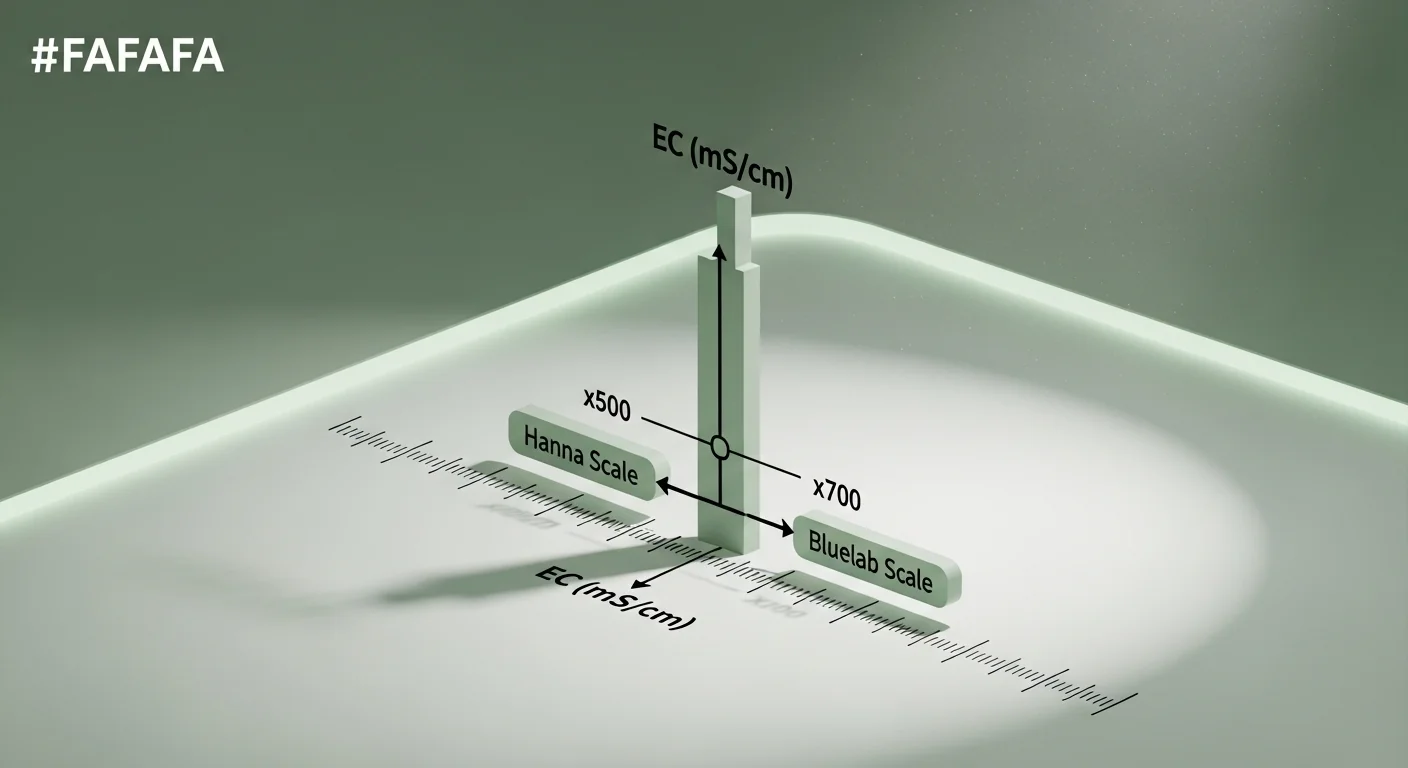
Electrical conductivity and parts per million measure the same thing — the dissolved solids in your nutrient solution — but the number your meter displays depends entirely on which internal conversion factor it uses. A Bluelab Truncheon reading of 1260 PPM and a Hanna HI98318 reading of 900 PPM can both describe the same solution at EC 1.8 mS/cm. That gap is not a calibration problem. It is a scale problem, and confusing the two is the single most common reason hydroponic growers misjudge their feed strength.
This tool converts between EC (mS/cm), PPM 500 (the Hanna/Eutech scale), and PPM 700 (the Bluelab/Truncheon scale) using the exact arithmetic each manufacturer applies internally. It does not correct for temperature drift, ionic composition, or nutrient-specific conductance — those variables require a full hydroponic EC calculator with solution-specific inputs. What this converter does is eliminate the unit confusion that makes crop-schedule PPM targets meaningless without knowing which meter generated them.
After using this tool, you will know the EC equivalent of any PPM reading on any common meter, whether your nutrient solution is inside or outside the safe range for most crops, and which PPM number to use when a crop schedule lists only one scale.
Use the Tool
PPM ↔ EC Converter
Hydroponic nutrient solution strength calculator — The Yield Grid
| EC (mS/cm) | PPM 500 (Hanna) | PPM 700 (Bluelab) | Use Case |
|---|---|---|---|
| 0.4 | 200 | 280 | Seedlings / clones |
| 0.8 | 400 | 560 | Early veg |
| 1.4 | 700 | 980 | Full veg |
| 1.8 | 900 | 1260 | Transition / early flower |
| 2.2 | 1100 | 1540 | Peak flower |
| 3.0 | 1500 | 2100 | ⚠ Nutrient burn threshold |
| 4.0 | 2000 | 2800 | 🔴 Danger — most plants |
Assumptions & Limits
Valid EC input range: 0 – 10 mS/cm. Values above 10 are impractical in most grow systems.
Valid PPM range: 0 – 7000 PPM (any scale). Beyond this, results are informational only.
Scale assumptions: PPM 500 uses the Hanna/Eutech conversion (×500 factor). PPM 700 uses the Bluelab/Truncheon conversion (×700 factor). These are approximate—actual ionic concentration depends on nutrient composition.
Nutrient burn threshold: EC > 3.0 mS/cm is flagged as a risk for most commonly grown species. Hardier plants (tomatoes, peppers) may tolerate up to EC 4.0.
Temperature: This calculator does not correct for solution temperature. EC readings vary by ~2% per °C. Calibrate your meter at 25°C (77°F) for consistent results.
How this calculator works
PPM to EC Converter uses the industry-standard conversion factors between Electrical Conductivity (EC, measured in mS/cm) and Parts Per Million (PPM), which varies by the meter’s internal scale factor.
Formulas used:
Steps:
- You enter a value and select whether it is EC, PPM 500, or PPM 700.
- The calculator converts to EC first (if input is PPM, divide by scale factor).
- From EC, all three outputs are derived: EC as-is, PPM 500 = EC × 500, PPM 700 = EC × 700.
- A safety check compares the EC value against the 3.0 mS/cm nutrient burn threshold.
Units: EC in mS/cm (milliSiemens per centimetre). PPM in mg/L (milligrams per litre), also written as ppm.
Before converting, have your meter reading in hand. Know the brand and model of your TDS or EC meter — Bluelab, Truncheon, and Milwaukee instruments almost always use the 700 scale, while Hanna, HM Digital, and Eutech instruments typically use the 500 scale. If you are unsure, check the meter manual for “conversion factor” or “TDS factor.” Enter the raw number your meter displays, select the matching scale, and the tool outputs all three formats simultaneously along with a nutrient burn risk check. For growers also tracking vapor pressure deficit alongside nutrient concentration, the VPD calculator complements this tool in a complete environmental monitoring workflow.
Quick Start (60 Seconds)
- Input Value: Enter the number your meter currently displays — do not round or guess. If your meter shows 1540, enter 1540, not 1500.
- Input Unit — EC: Select this if your meter displays mS/cm or dS/m. EC 1.8 mS/cm and EC 1.8 dS/m are the same number; no conversion needed between those two.
- Input Unit — PPM 500 (Hanna): Select this for Hanna Instruments, Eutech, HM Digital, and most blue/yellow handheld TDS pens sold in aquarium stores.
- Input Unit — PPM 700 (Bluelab/Truncheon): Select this for Bluelab Combo Meter, Bluelab Truncheon, Milwaukee TDS meters, and any meter explicitly labelled “700 scale.”
- Do not mix a PPM reading from one scale with a target from another scale. If your nutrient schedule says “900 PPM” but does not specify the scale, ask the manufacturer which meter the schedule was written for.
- Zero check: Pure reverse-osmosis or distilled water should read between EC 0.0 and EC 0.05. A reading of EC 0.3 on your baseline water means your source already contributes dissolved solids and your final nutrient reading will be inflated by that amount.
- Click Calculate — do not press Enter mid-form. Results appear below the button with the EC equivalent, both PPM formats, and a real-time safety zone indicator.
Inputs and Outputs (What Each Field Means)
| Field | Unit | What It Measures | Common Mistake | Safe Entry Guidance |
|---|---|---|---|---|
| Input Value | Unitless (number) | The raw reading from your EC or TDS meter | Entering the value from a different test (pH reading, temperature) by mistake | Read directly from meter display; accept one or two decimal places |
| Input Unit | EC / PPM 500 / PPM 700 | The scale your meter uses internally to convert conductance to a displayed number | Selecting EC when the meter actually displays PPM, or vice versa | Check your meter’s spec sheet for “TDS factor” or “conversion factor” |
| EC Output | mS/cm | Electrical conductivity — the universal, scale-independent measure of dissolved ion load | Confusing mS/cm with dS/m (they are equal; dS/m is just used in soil science) | Compare against your crop’s published EC schedule, not a PPM target |
| PPM 500 Output | PPM (Hanna scale) | EC multiplied by 500 — the value a Hanna or Eutech meter would display | Using this number on a Bluelab meter chart, which understates the actual EC by 28.6% | Use only when communicating with growers confirmed to use the 500 scale |
| PPM 700 Output | PPM (Bluelab scale) | EC multiplied by 700 — the value a Bluelab or Truncheon meter would display | Treating this number as a universal PPM; it is only accurate on 700-scale meters | Use when following Bluelab-authored crop schedules or communicating with Bluelab users |
| EC Gauge Bar | Visual (0 to 4.5 mS/cm) | Relative position of the EC reading within the safe-to-dangerous range for most crops | Assuming the “safe” zone applies equally to all species and growth stages | Use as a directional check, not a species-specific prescription |
| Nutrient Check Box | Status (safe / high / danger) | Flags if EC exceeds 3.0 mS/cm, the threshold above which most crops risk burn | Ignoring the warning because a crop grew fine at EC 3.2 previously | Any danger flag warrants dilution or a flush before the next feeding cycle |
Worked Examples (Real Numbers)
Example 1: EC Reading to Both PPM Scales
- Input: EC 1.8 mS/cm
- Input unit: EC
Result: PPM 500 = 1.8 x 500 = 900 PPM (Hanna); PPM 700 = 1.8 x 700 = 1260 PPM (Bluelab)
The same nutrient solution produces two completely different numbers depending on which meter you hold. A grower using a Hanna pen who tells a colleague “run at 900 PPM” and that colleague owns a Bluelab Truncheon will run their crop at EC 1.29 — 28% below the intended strength — unless the scale is specified.
Example 2: Hanna PPM Reading to EC
- Input: 1100 PPM
- Input unit: PPM 500 (Hanna)
Result: EC = 1100 / 500 = 2.2 mS/cm
EC 2.2 mS/cm sits in the upper end of the safe zone for most fruiting crops in full flower. The nutrient check indicator will show yellow — a prompt to monitor closely but not yet cause for immediate dilution unless plants are showing stress signals.
Example 3: Bluelab Truncheon Reading at the Burn Threshold
- Input: 2100 PPM
- Input unit: PPM 700 (Bluelab)
Result: EC = 2100 / 700 = 3.0 mS/cm
EC 3.0 mS/cm is exactly the nutrient burn threshold. The tool flags this as danger. Sensitive crops such as lettuce, basil, or strawberries in this solution will typically show marginal leaf scorch within two to three feed cycles. Dilute to bring EC below 2.5 mS/cm before the next irrigation.
Reference Table (Fast Lookup)
| EC (mS/cm) | PPM 500 — Hanna | PPM 700 — Bluelab | Scale Mismatch Error (PPM) | Typical Growth Stage | Risk Level |
|---|---|---|---|---|---|
| 0.1 | 50 | 70 | 20 | Pure water / baseline | Deficiency if sustained |
| 0.4 | 200 | 280 | 80 | Seedlings / clones | Safe |
| 0.8 | 400 | 560 | 160 | Early vegetative | Safe |
| 1.2 | 600 | 840 | 240 | Mid vegetative | Safe |
| 1.8 | 900 | 1260 | 360 | Transition / early flower | Safe |
| 2.2 | 1100 | 1540 | 440 | Peak flower | Monitor (high) |
| 2.6 | 1300 | 1820 | 520 | Late flower / heavy feeders | High — stress risk |
| 3.0 | 1500 | 2100 | 600 | Burn threshold | Danger for most crops |
| 3.5 | 1750 | 2450 | 700 | Above safe limit | Danger |
| 4.0 | 2000 | 2800 | 800 | Severe overfeeding | Critical — flush immediately |
The “Scale Mismatch Error” column shows how many PPM points you will be off if you read a PPM 700 value and treat it as PPM 500 (or vice versa). At EC 3.0, the mismatch produces a 600-PPM misread — enough to push a grower who thinks they are at 1500 PPM (Hanna) into what is actually a 2100 PPM (Bluelab) solution without realizing it.
How the Calculation Works (Formula + Assumptions)

Show the calculation steps
The conversion uses two fixed scale factors assigned by meter manufacturers:
- PPM 500 scale (Hanna, Eutech): PPM = EC x 500. To reverse: EC = PPM / 500.
- PPM 700 scale (Bluelab, Truncheon): PPM = EC x 700. To reverse: EC = PPM / 700.
When you enter a value, the tool first converts everything to EC:
- If input is EC: EC = entered value.
- If input is PPM 500: EC = entered value / 500.
- If input is PPM 700: EC = entered value / 700.
Once EC is known, the other two outputs are derived:
- PPM 500 = EC x 500 (rounded to nearest whole number)
- PPM 700 = EC x 700 (rounded to nearest whole number)
- EC is displayed to two decimal places (e.g., 2.20 mS/cm)
Rounding rule: PPM outputs use Math.round() — values of .5 and above round up, below .5 round down. EC uses .toFixed(2) for two decimal precision.
Assumptions and Limits
- The 500 and 700 scale factors are approximations. Different nutrient formulations have different ionic compositions, so actual ionic PPM can vary from the converted number by a measurable margin.
- This tool does not account for solution temperature. EC readings change by roughly 2 percent per degree Celsius. Most meters auto-compensate to 25 degrees C (77 degrees F), but uncompensated readings in cold or hot reservoirs will differ.
- Maximum valid EC input is 10 mS/cm. Values above this are outside the practical range of any hydroponic system and the tool will display a validation error.
- A baseline water EC above 0.0 is not subtracted automatically. Growers using well water, municipal water, or partially recirculated solution should subtract baseline EC from the final reading to estimate nutrient-only EC.
- The nutrient burn threshold of EC 3.0 mS/cm is a general industry reference point. Hardier crops such as tomatoes and peppers may tolerate up to EC 4.0 mS/cm. Delicate crops such as lettuce and herbs may show stress above EC 2.0 mS/cm.
- PPM 500 and PPM 700 are not the only conversion scales in existence. Some older European meters use a 640 factor. If your meter documentation specifies a different factor, divide your PPM reading by that factor to obtain EC, then use this tool’s EC input field.
Standards, Safety Checks, and “Secret Sauce” Warnings
Critical Warnings
- EC above 3.0 mS/cm triggers nutrient burn. The tool flags this explicitly. Symptoms in most crops: upward leaf curl, brown crispy tips, and wilting despite adequate moisture. Root damage can occur before visible foliar symptoms appear.
- Scale mismatch is invisible without conversion. A grower running a Bluelab meter on a Hanna-scale schedule will underfeed their crop at every stage. A grower doing the reverse will systematically overfeed. Neither mistake generates an obvious error signal — the meter just shows a number. Always identify the scale before trusting the number. Using a cal-mag dosage calculator on a misidentified PPM reading, for instance, will produce incorrect supplement volumes.
- Source water EC is additive. If your tap or well water reads EC 0.4, and you mix nutrients to a target of EC 1.8, the combined solution will read EC 2.2 or higher — not 1.8. Measure source water first and account for it.
- Recirculating systems accumulate EC over time. In deep water culture and NFT channels, evaporation concentrates dissolved solids while water leaves. EC will creep upward between reservoir top-ups. Top up with plain water, not nutrient solution, when reservoir level drops without a corresponding rise in EC. For precise dosing across a full system, a hydroponic nutrient dosing calculator is the appropriate next tool.
Minimum Standards
- EC 0.4 to 0.8 mS/cm: minimum acceptable range for seedlings and newly rooted clones.
- EC 1.2 to 2.4 mS/cm: the broadly accepted working range for most vegetative and flowering hydroponic crops.
- EC 3.0 mS/cm: the universally cited upper safety limit for sensitive and moderately tolerant species. Do not exceed without species-specific confirmation.
- EC measurement frequency: check at minimum every 48 hours in active recirculating systems; every 24 hours during high-temperature periods when evaporation is accelerated.
Competitor Trap: Many PPM-to-EC reference pages list a single conversion table and never specify which PPM scale it uses. A reader with a Bluelab meter following a “1000 PPM = EC 2.0” table (which assumes the 500 scale) would actually be running EC 1.43 — 28.5 percent below the intended concentration. No warning, no red flag, just a chronically underfed crop that looks like a micronutrient problem. The scale must always be declared alongside any PPM number.
Common Mistakes and Fixes
Mistake: Assuming All PPM Meters Use the Same Scale
The number displayed on a TDS pen is not a universal unit — it is EC multiplied by a scale factor that varies by manufacturer. Two meters dipped in the same reservoir can display readings that differ by 200 PPM or more without either meter being faulty or out of calibration. Growers who switch meters mid-grow often diagnose the reading gap as a deficiency when it is actually a scale change.
Fix: Check the meter’s documentation for “TDS factor” or “conversion factor.” Use the corresponding input unit in this tool before comparing against any crop schedule.
Mistake: Using PPM Targets From a Nutrient Schedule Without Knowing the Scale
Nutrient manufacturers often publish crop schedules with PPM targets but do not always state which scale those targets were generated on. A schedule written for Hanna meters and followed on a Bluelab meter will systematically underfeed the crop at every growth stage. The plants may grow slowly or show deficiency symptoms that look like pH or root problems.
Fix: Contact the nutrient manufacturer and ask which PPM scale their schedules use. If no answer is available, use EC mS/cm targets instead — EC is scale-independent and consistent across all meters.
Mistake: Not Subtracting Source Water EC from the Final Reading
Tap water, well water, and municipal supplies often carry dissolved minerals that register on an EC meter. A baseline of EC 0.3 to 0.6 mS/cm is common in many regions. If a grower targets EC 1.8 without measuring source water first, the crop may actually receive EC 2.1 to 2.4 mS/cm — well into the high-stress zone over time. Using a pH adjustment calculator before and after nutrient mixing also helps catch anomalies in source water chemistry.
Fix: Measure and record baseline source water EC before every reservoir mix. Subtract it from the target EC when adding nutrients.
Mistake: Checking EC Once and Not Monitoring Drift
In recirculating systems, plants absorb water faster than dissolved nutrients during periods of high transpiration or heat stress. This causes EC to rise passively as the water volume decreases. A reservoir checked at EC 1.8 on Monday can read EC 2.6 or higher by Wednesday without any additional nutrients being added.
Fix: Top up reservoirs with plain, pH-adjusted water when EC rises above target. Never add more nutrient solution to a reservoir that already reads above your target EC.
Mistake: Treating the Nutrient Burn Threshold as a Universal Ceiling
The 3.0 mS/cm burn threshold appears on nearly every hydroponic reference chart, but it is a population average, not a hard biological limit. Lettuce, herbs, and strawberries can show tip burn above EC 2.0 mS/cm. Tomatoes and cucumbers in productive flower may comfortably operate at EC 3.5 mS/cm. Applying a single threshold across all crops leads to both underfeeding and overfeeding errors depending on species.
Fix: Look up the species-specific EC range for your crop from a peer-reviewed agronomy source or the nutrient manufacturer’s crop table. Use the 3.0 mS/cm limit as a ceiling only when species-specific data is unavailable.
Next Steps in Your Workflow
Once you have confirmed the EC equivalent of your nutrient reading and verified it falls within the safe range for your crop stage, the next variable that most directly affects nutrient uptake is solution temperature. Cold water — below 18 degrees C — slows root absorption and can cause plants to display deficiency symptoms even when EC is correct. The water temperature calculator helps determine whether your chiller or heater is maintaining the root zone within the uptake-optimal range of 18 to 22 degrees C.
If you are running a recirculating system and EC is climbing faster than expected between top-ups, the issue is often a combination of high evapotranspiration and undersized reservoir volume. Tracking vapor pressure deficit alongside EC gives a more complete picture of why plants are drawing water disproportionately to nutrients. The crop steering calculator pairs well with EC management for growers who want to modulate vegetative versus generative responses through controlled nutrient and irrigation adjustments.
FAQ
What is the difference between EC and PPM in hydroponics?
EC (electrical conductivity) measures the ability of a solution to conduct electricity, expressed in mS/cm. PPM (parts per million) is a concentration unit derived from EC by multiplying by a scale factor. The distinction that matters is which scale factor your meter uses — either 500 (Hanna) or 700 (Bluelab). Both describe the same dissolved-ion load; neither is more accurate than the other.
Which PPM scale is more accurate — 500 or 700?
Neither is inherently more accurate. Accuracy depends on whether the scale matches what your meter actually uses. The 500 scale was originally derived from a sodium chloride solution standard; the 700 scale from a potassium chloride standard. In a mixed nutrient solution, both are approximations of true ionic concentration. EC in mS/cm is the only reading that does not require knowing your meter’s internal factor.
Why does my EC meter and PPM meter give different readings on the same solution?
They should, unless your PPM meter happens to use a scale factor that converts to the exact EC your meter reads. If you convert the PPM reading using the correct scale factor and arrive at the same EC, the meters agree. If the EC still differs after conversion, suspect calibration error, probe fouling, or a different calibration solution standard between the two meters.
What EC should I target for seedlings?
Most seedling and clone references recommend EC 0.4 to 0.8 mS/cm. This corresponds to 200 to 400 PPM on the 500 scale, or 280 to 560 PPM on the 700 scale. Starting high risks root stress and stunted establishment. It is generally safer to begin at the lower end and raise EC gradually as the root system develops.
How often should I check EC in my hydroponic reservoir?
At minimum, every 48 hours for recirculating systems under normal conditions. During hot weather, high-transpiration periods, or peak flower stages when nutrient uptake is rapid, check every 24 hours. A significant rise in EC without added nutrients indicates the plants are consuming water faster than ions — top up with plain water rather than more nutrient solution.
Can I use this converter for soil or coco coir growing?
Yes, for measuring and converting feed solution EC or PPM before application. Soil and coco coir add their own buffering complexity, and run-off EC from those substrates does not have a simple fixed relationship to the input feed EC. This tool addresses the feed-solution conversion only; run-off interpretation requires additional context about substrate saturation and buffering history.
Conclusion
The PPM to EC converter exists to solve one specific, recurring problem: nutrient readings that are technically correct but practically meaningless because the scale was never declared. EC in mS/cm is the only unit that travels cleanly between meter brands, crop schedules, and growing communities. Any time a PPM number is passed from one person to another without specifying whether it is a 500-scale or 700-scale reading, there is a real probability of a 28-percent dosing error in either direction.
The single most avoidable mistake in hydroponic nutrient management is trusting a PPM number from a schedule, forum post, or fellow grower without asking which meter they used to build it. Use EC as your working unit whenever possible, and use this tool when you need to translate a PPM reading into universal terms. For growers managing a full recirculating system, pairing accurate EC monitoring with proper reservoir temperature control — available through the hydroponic water chiller calculator — covers the two environmental variables that most directly determine whether dissolved nutrients are actually available to roots.
Lead Data Architect
Umer Hayiat
Founder & Lead Data Architect at TheYieldGrid. I bridge the gap between complex agronomic data and practical growing, transforming verified agricultural science into accessible, mathematically precise tools and guides for serious growers.
View all tools & guides by Umer Hayiat →


