
Electrical conductivity is not a proxy for plant nutrition, it is a measure of dissolved ions in solution, including ions that have nothing to do with plant-available nutrients. A reservoir reading 1.8 mS/cm on a Bluelab Truncheon contains a very different nutrient profile than a reservoir reading 1.8 mS/cm on a Hanna meter using the 500 scale, and the gap widens further when source water carries its own dissolved solids. This is where most growers make decisions that quietly cost them yield.
This hydroponic EC calculator computes total reservoir EC by adding your source water’s baseline EC to the EC contributed by your nutrient solution, then converts the result to PPM using either the 500 or 700 scale. It also applies three deterministic safety checks: hard water lockout risk, nutrient burn at the seedling threshold, and osmotic pressure reversal at the root zone. What it does not do is account for pH, water temperature, individual ion ratios, or reservoir volume. Those variables require separate tools.
After running this calculator, you will know whether your source water disqualifies your current nutrient mixing strategy before you fill your reservoir and stress your plants.
Use the Tool
EC/PPM & Osmotic Pressure Calculator
Prevent nutrient burn & hard water lockout — dial in your hydroponic reservoir
- All checks passed — reservoir is within safe operating parameters.
| Stage | Target EC (mS/cm) | PPM @ 500 Scale | PPM @ 700 Scale |
|---|
How This Calculator Works — Formula Steps & Assumptions
Step 1 — Total EC Calculation
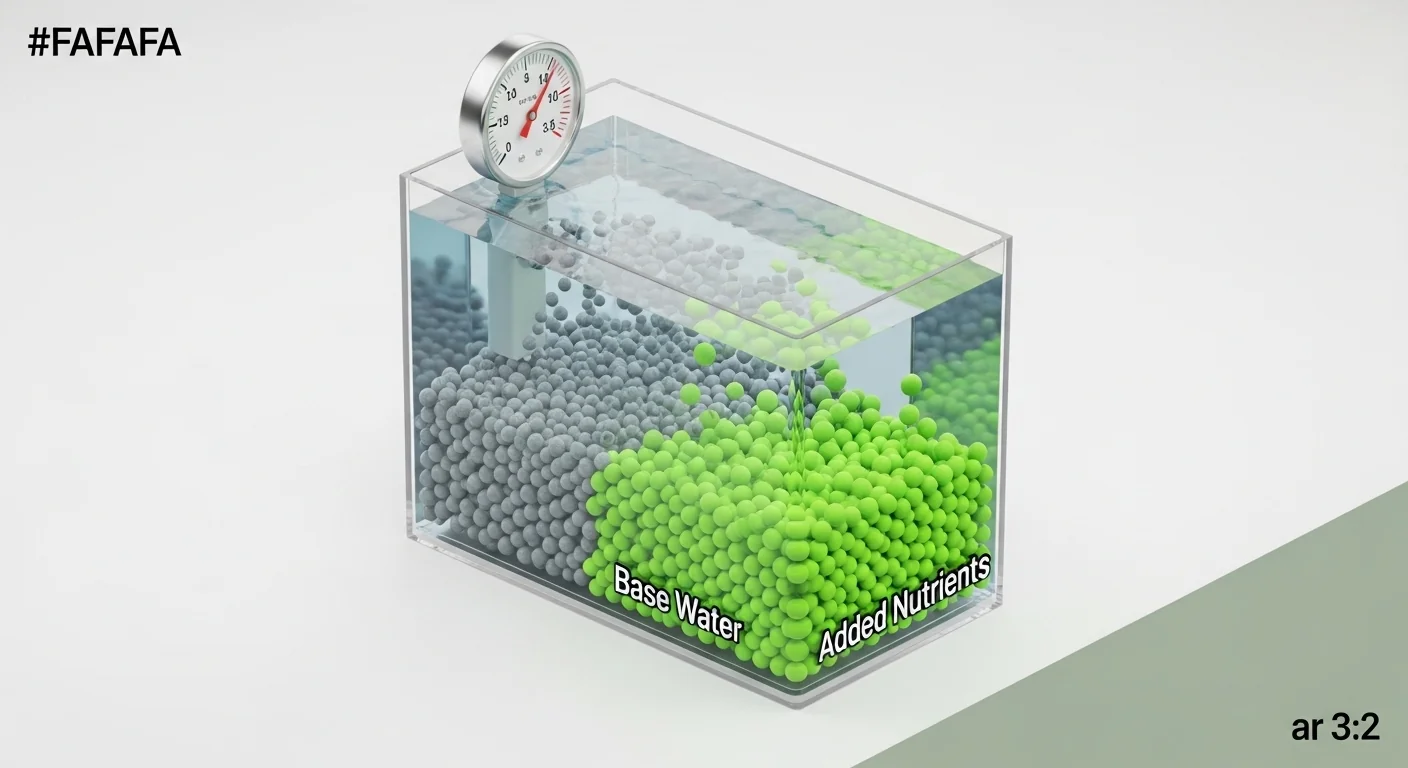
The total reservoir EC is the sum of your source water EC plus the EC contributed by the nutrients you add:
Step 2 — PPM Conversion
EC is converted to PPM using the chosen scale. Two industry standards exist:
500 scale (Hanna/Milwaukee) and 700 scale (Truncheon/Bluelab) are the most common. Always check which your meter uses.
Step 3 — Nutrient Burn Check (Secret Sauce)
If the plant stage is Seedling and Total EC exceeds 1.2 mS/cm, nutrient burn risk is triggered. Seedlings have underdeveloped root systems and cannot tolerate high osmotic pressure.
Step 4 — Hard Water Lockout Check (Secret Sauce)
If base water EC exceeds 0.4 mS/cm, calcium carbonate and bicarbonate salts are likely present at levels that compete with nutrient uptake. RO filtration is mandated.
Step 5 — Osmotic Pressure Danger
At very high EC levels (>3.5 mS/cm), osmotic pressure can reverse across root cell membranes. Rather than absorbing water, plant roots may actually lose water to the surrounding solution (a process called reverse osmosis at the root zone). This causes wilting, tip burn, and cell death — even with abundant water in the reservoir.
Assumptions & Limits
- EC readings assume a calibrated meter at 25°C (77°F). Temperature significantly affects EC readings.
- Base water EC must be measured fresh — EC can change seasonally in municipal supplies.
- PPM conversion factors (500 vs 700) are industry conventions, not exact chemical equivalents.
- Nutrient burn thresholds are generalized guidelines; specific cultivar sensitivity varies.
- This tool does not account for pH, which strongly affects nutrient availability.
- Reservoir volume, plant count, and feeding frequency are not modeled here.
Before entering values, have three measurements ready: a calibrated EC meter reading of your source water (taken before adding any nutrients), your nutrient bottle's target dose expressed as an EC contribution, and your meter's scale setting. If you only have a PPM reading from your source water and need to convert it to EC first, the PPM to EC converter will produce the correct mS/cm value for this calculator's base water field. Use the same scale throughout, mixing 500-scale and 700-scale readings in one calculation produces meaningless totals.
Quick Start (60 Seconds)

- Base Water EC (mS/cm): Measure your tap, well, or RO output before any nutrients are added. Do not guess or use published municipal averages, which can vary by season and by neighborhood. Enter the live reading in mS/cm, not PPM.
- Target Plant Stage: Select the growth stage your plants are currently in, not the stage you are targeting next. Seedling thresholds are stricter because root systems cannot regulate high osmotic loads.
- EC to PPM Scale: Check your meter's manual or display mode. Hanna, Milwaukee, and most North American budget meters use the 500 scale. Bluelab, Eutech, and Truncheon meters use the 700 scale. Mixing scales across readings is the most common source of error in hydroponic forums.
- Added Nutrient EC (mS/cm): This is the EC your nutrients contribute to the reservoir, not the final total. Mix your nutrients into a small volume of RO water, read the EC, and enter that value. Do not enter a target or a label recommendation here.
- Nutrient Part A Ratio (%): Enter Part A as a percentage of your total nutrient volume. A standard 1:1 two-part formula = 50. A 60/40 vegetative-forward mix = 60. This field affects the display only and does not change the EC calculation.
Inputs and Outputs (What Each Field Means)
| Field Name | Unit | What It Measures | Common Mistake | Safe Entry Guidance |
|---|---|---|---|---|
| Base Water Starting EC | mS/cm | Electrical conductivity of source water before any nutrients are dissolved | Using a PPM reading without converting, or entering tap water EC from a utility report rather than a live meter reading | 0.0 (pure RO) to 0.4 mS/cm; above 0.4 triggers a mandatory RO filtration warning |
| Target Plant Stage | Category | Growth phase that sets the burn threshold and acceptable EC range for evaluation | Selecting "Veg" for recently transplanted seedlings because they are out of the germination tray | Use "Seedling" until the plant has established 3+ true nodes with visible root mass |
| EC to PPM Scale | Conversion factor (500 or 700) | The multiplier your specific meter applies to convert conductance to an approximate parts-per-million reading | Assuming all meters use the same scale; a reading of 1.5 mS/cm becomes 750 ppm (500 scale) or 1050 ppm (700 scale), a 300 ppm gap that changes feeding decisions | Check meter documentation. When in doubt, report the mS/cm value directly instead of converting |
| Added Nutrient EC | mS/cm | The conductivity increase caused by the nutrients you are adding, isolated from source water baseline | Entering the target reservoir EC rather than the nutrient contribution alone, causing the tool to double-count source water EC | Mix nutrients into a small volume of RO water and measure before adding to reservoir |
| Nutrient Part A Ratio | Percentage (0-100) | The proportion of Part A in the total two-part nutrient dose | Entering the ratio from a three-part formula as if it were a two-part split | Standard two-part formulas default to 50. Check label for stage-specific adjustments |
| Total EC (output) | mS/cm | The calculated sum of base water EC and added nutrient EC | Treating this as an absolute nutrient concentration rather than a conductivity proxy | Compare against stage range: Seedling 0.4-1.2, Veg 1.2-2.0, Bloom 2.0-3.0 mS/cm |
| PPM output | ppm | Total EC multiplied by the selected scale factor | Comparing this PPM value against a target from a grower using a different scale | Only compare PPM values measured on the same scale |
Worked Examples (Real Numbers)
Scenario 1: City Tap Water with Seedlings
- Base Water EC: 0.8 mS/cm (city tap with calcium carbonate)
- Plant Stage: Seedling
- Scale: 500 (Hanna meter)
- Added Nutrient EC: 0.4 mS/cm
- Part A Ratio: 50%
Result: Total EC = 0.8 + 0.4 = 1.2 mS/cm. PPM (500 scale) = 600 ppm.
Two warnings fire simultaneously: the source water EC of 0.8 mS/cm exceeds the 0.4 mS/cm hard water threshold, mandating RO filtration, and the total EC of 1.2 mS/cm sits exactly at the seedling burn limit. The grower followed the nutrient bottle's dose, but the city water did all the damage before a single drop of concentrate was added.
Scenario 2: RO Water, Vegetative Stage, Truncheon Meter
- Base Water EC: 0.05 mS/cm (fresh RO output)
- Plant Stage: Veg
- Scale: 700 (Bluelab Truncheon)
- Added Nutrient EC: 1.6 mS/cm
- Part A Ratio: 50%
Result: Total EC = 0.05 + 1.6 = 1.65 mS/cm. PPM (700 scale) = 1,155 ppm.
The reservoir falls cleanly within the vegetative range of 1.2 to 2.0 mS/cm. No safety warnings trigger. The near-zero source water EC confirms RO filtration is working correctly and leaves full headroom for nutrient targeting without interference from dissolved minerals.
Scenario 3: Heavy Bloom Osmotic Pressure Danger
- Base Water EC: 0.2 mS/cm (light well water)
- Plant Stage: Heavy Bloom
- Scale: 500 (TDS meter)
- Added Nutrient EC: 3.4 mS/cm
- Part A Ratio: 40%
Result: Total EC = 0.2 + 3.4 = 3.6 mS/cm. PPM (500 scale) = 1,800 ppm.
The total EC of 3.6 mS/cm exceeds the 3.5 mS/cm osmotic reversal threshold. At this concentration, the solution outside root cells is more concentrated than the solution inside them. The osmotic gradient reverses, meaning roots may lose water to the reservoir rather than absorbing it, producing wilting symptoms in a full reservoir. Immediate dilution below 3.0 mS/cm is required.
Reference Table (Fast Lookup)
| Plant Stage | Base Water EC (mS/cm) | Nutrient EC Added (mS/cm) | Total EC (mS/cm) | PPM (500 Scale) | PPM (700 Scale) | Safety Status |
|---|---|---|---|---|---|---|
| Seedling | 0.0 | 0.6 | 0.6 | 300 | 420 | Safe |
| Seedling | 0.0 | 1.0 | 1.0 | 500 | 700 | Safe (near limit) |
| Seedling | 0.4 | 0.8 | 1.2 | 600 | 840 | At burn threshold + hard water warning |
| Seedling | 0.8 | 0.4 | 1.2 | 600 | 840 | Hard water lockout + burn risk |
| Veg | 0.05 | 1.5 | 1.55 | 775 | 1,085 | Safe |
| Veg | 0.3 | 1.7 | 2.0 | 1,000 | 1,400 | Hard water warning + at range limit |
| Bloom | 0.1 | 2.2 | 2.3 | 1,150 | 1,610 | Safe |
| Bloom | 0.2 | 2.6 | 2.8 | 1,400 | 1,960 | Safe (upper range) |
| Bloom | 0.0 | 3.5 | 3.5 | 1,750 | 2,450 | At osmotic reversal limit |
| Bloom | 0.2 | 3.4 | 3.6 | 1,800 | 2,520 | Osmotic danger |
How the Calculation Works (Formula + Assumptions)
Show the calculation steps
Step 1: Total EC
Total Reservoir EC (mS/cm) = Base Water EC + Added Nutrient EC
This is a linear addition. No correction factors apply. Both values must be in mS/cm before adding. If your nutrient concentrate EC was measured in a small diluted sample, it is already the additive EC, not a concentrate value.
Step 2: PPM Conversion
PPM (500 scale) = Total EC x 500
PPM (700 scale) = Total EC x 700
Rounding: values are rounded to the nearest whole number. No decimal places are used for PPM display. The 500 and 700 factors are industry conventions, not chemical equivalents, so these PPM values are approximations of dissolved solid concentration, not exact ion counts.
Step 3: Burn Threshold Check
If Stage = Seedling AND Total EC is greater than 1.2 mS/cm, the nutrient burn warning fires. Seedling threshold is hard-coded at 1.2 mS/cm. For Veg and Bloom stages, the maximum safe EC is flagged at 3.5 mS/cm for the osmotic reversal check.
Step 4: Hard Water Check
If Base Water EC is greater than 0.4 mS/cm, the hard water lockout warning fires regardless of stage or total EC. This threshold reflects the point at which dissolved calcium carbonate, bicarbonates, and sulfates begin interfering with nutrient ion uptake and pH stability.
Step 5: Osmotic Reversal Check
If Total EC exceeds 3.5 mS/cm, the osmotic pressure warning fires. At this concentration level, the dissolved salt concentration in the reservoir can exceed the ionic concentration inside root cells, reversing the osmotic gradient and causing net water loss from roots to solution.
Assumptions and Limits
- All EC readings are assumed to be taken at 25 degrees Celsius. EC is temperature-dependent: conductance rises roughly 2% per degree Celsius above the calibration point, so an uncompensated meter in a warm reservoir will read artificially high.
- The 500 and 700 scale conversion factors are approximations. They do not reflect the actual ionic composition of the solution. Two reservoirs at the same EC may have very different nutrient profiles depending on the fertilizer formulation used.
- This tool assumes nutrient EC is additive and linear. In very high-concentration solutions, ion pairing and activity coefficients reduce this linearity, but the error is negligible below 4.0 mS/cm.
- Base water EC is assumed to be stable at the time of measurement. Municipal water EC can shift by 0.1 to 0.3 mS/cm across seasons or during drought-related supply changes.
- The tool does not model pH. A reservoir within safe EC range can still lock out nutrients if pH drifts outside the 5.5 to 6.5 range typical for most hydroponic systems.
- Reservoir volume, plant count, transpiration rate, and daily top-off frequency are not modeled. A 20-gallon reservoir and a 200-gallon reservoir with identical EC readings behave very differently as plants uptake nutrients selectively over time.
- The Nutrient A/B ratio field affects the results display only. Changing this ratio does not alter the Total EC or PPM calculation.
Standards, Safety Checks, and "Secret Sauce" Warnings
Critical Warnings
- Hard Water Lockout: Source water above 0.4 mS/cm contains calcium carbonate, bicarbonate alkalinity, or sulfate levels that directly compete with plant-available calcium, magnesium, and iron. The nutrient bottle's recommended dose was calibrated for RO or near-zero source water. Adding that dose on top of 0.8 mS/cm city tap water does not produce the expected EC of 1.5 mS/cm from nutrients alone. It produces 2.3 mS/cm total, and a significant fraction of that conductivity is from ions your plants cannot use.
- Osmotic Pressure Reversal: When total reservoir EC exceeds approximately 3.5 mS/cm, the dissolved salt concentration outside root cells can exceed the turgor pressure inside them. Roots evolved to absorb water through osmosis because cellular fluid is more concentrated than the surrounding medium. At extreme EC levels, this gradient reverses. Plants show wilting symptoms with wet substrate because the water flow direction has flipped at the cellular level. This is not nutrient deficiency and will not be fixed by adding more nutrients.
- Seedling Burn Threshold: Seedlings lack the root surface area and cation exchange capacity to buffer high ionic loads. The 1.2 mS/cm limit for seedlings is not arbitrary caution; it reflects the documented point at which tender root hairs begin sustaining salt damage. A seedling stressed by excess EC at week one may recover, but it will carry that root damage into vegetative growth.
- Scale Mismatch: Comparing a PPM target from a grower using a 700-scale Truncheon to your 500-scale meter target produces a systematic error of 28 to 40%. A safe 1,400 ppm on a 700-scale meter corresponds to 2.0 mS/cm. The same 2.0 mS/cm on a 500-scale meter reads as 1,000 ppm. Acting on the wrong scale target can push seedlings into burn territory while believing you are underfeeding.
Minimum Standards
- Source water EC below 0.4 mS/cm before nutrients are added. Above this, RO filtration or an RO/DI blending strategy is the baseline requirement, not an optional upgrade.
- Seedling maximum total EC of 1.2 mS/cm. For clones and newly germinated seedlings in the first two weeks, targets in the 0.6 to 1.0 mS/cm range reduce transplant stress further.
- Vegetative range of 1.2 to 2.0 mS/cm total EC. Most two-part formulas at manufacturer dose land in this range on RO water.
- Bloom maximum of 3.0 mS/cm for most crops, with 3.5 mS/cm as the absolute upper limit before osmotic reversal risk becomes significant.
Competitor Trap: Most EC calculator pages and nutrient company guides show target PPM or EC ranges without accounting for source water EC at all. The instruction "add 5 ml per gallon to reach 1.5 EC" assumes you start from zero. A grower on city water with a baseline of 0.8 mS/cm who follows this instruction adds 5 ml per gallon, reads 2.3 mS/cm on their meter, assumes something is wrong with the reading, and starts over, compounding the error. The tool page you are reading right now is one of the few that forces the baseline EC input before accepting any nutrient EC value. That is the difference between a PPM chart and an actual decision tool. For growers also managing leaf vapour pressure deficit as a steering input, the VPD calculator works alongside EC management to keep transpiration and uptake rates aligned with reservoir concentration.
When calcium and magnesium deficiency symptoms appear alongside correct EC readings, the problem is often source water EC masking the nutrient EC contribution, which reduces the actual plant-available nutrient dose below what the total EC suggests. The cal-mag dosage calculator is useful for quantifying supplemental additions in hard water situations where source minerals are providing calcium in a form plants cannot access.
Common Mistakes and Fixes
Mistake: Using the Nutrient Label Dose on Tap Water Without Measuring Source EC First
Every nutrient company calibrates its dose recommendations against low-EC water, typically RO or deionized water below 0.05 mS/cm. When a grower adds the full label dose to city water starting at 0.6 or 0.8 mS/cm, the resulting reservoir EC can be 40 to 60% higher than the label's target range, without the grower realizing their water was the primary driver. The resulting symptoms, tip burn, curling leaves, and uptake slowdowns, often get diagnosed as pH problems or magnesium deficiency, leading to additional additives that worsen the ionic load.
Fix: Measure source water EC before mixing anything. Subtract the baseline from your target EC to calculate how much nutrient EC to actually add.
Mistake: Comparing PPM Targets Across Different Scale Meters
Online growing communities, YouTube channels, and printed grow guides rarely specify which PPM scale their recommendations use. A "safe seedling target of 400 ppm" from a Truncheon-using grower equals 0.57 mS/cm. The same advice applied with a 500-scale meter means targeting 0.80 mS/cm, which is 40% higher than intended and already approaching the seedling burn limit on clean RO water. The error is invisible unless both parties state their meter type.
Fix: Always work in mS/cm when sharing or following targets across different sources. EC is meter-agnostic. PPM is not.
Mistake: Confusing Total EC with Nutrient EC
Entering the total reservoir EC into the "Added Nutrient EC" field of this calculator, or any nutrient EC field, will cause the tool to add source water EC twice, inflating the total and triggering false warnings. This happens when growers measure the reservoir after mixing and record that reading as "what the nutrients contributed."
Fix: Always measure nutrient EC separately, in a nutrient-only sample with RO water, before combining with source water. The input fields are additive, not a final reading.
Mistake: Treating Stable EC as Proof of Healthy Nutrient Ratios
A reservoir that maintains 1.8 mS/cm across multiple days is not necessarily in balance. Plants uptake ions selectively. Calcium and potassium may be depleted while sodium, sulfate, and residual carbonate from tap water remain, keeping the EC reading artificially stable. The conductivity reading tells you the total ion load, not which ions are present.
Fix: Partial reservoir dumps and refills every 7 to 14 days prevent selective ion accumulation regardless of stable EC readings. Pair EC monitoring with periodic pH drift observation; a reservoir that requires increasing volumes of pH-down to hold stable pH is accumulating bicarbonate alkalinity that EC alone will not reveal. The pH-down dosing calculator can help size phosphoric or nitric acid additions against reservoir volume.
Mistake: Chasing Osmotic Damage with More Water Instead of Dilution
Wilting in a full reservoir at high EC is frequently misdiagnosed as root rot, a pump failure, or disease. Growers add plain water to the top of the reservoir assuming the plant is thirsty, but if the osmotic gradient has reversed, adding plain water to a high-EC reservoir only slightly dilutes the bulk solution while the root zone remains exposed to concentrated salt load between water changes.
Fix: When wilting occurs in a full reservoir, take an EC reading before any other diagnosis. If EC is above 3.0 mS/cm, perform a partial or full reservoir flush with fresh RO water and remix at the correct target EC for the current plant stage.
Next Steps in Your Workflow
Once your reservoir EC is confirmed within the appropriate stage range, the next variable affecting nutrient uptake is water temperature. Roots in water above 22 degrees Celsius face both reduced dissolved oxygen and increased susceptibility to Pythium and other root pathogens, regardless of EC. Similarly, water that is too cold slows enzymatic activity at the root surface, reducing the rate at which nutrients cross root membranes even at correct EC levels. If your grow environment creates water temperature swings, the hydroponic water chiller calculator can size a chiller against your reservoir volume and ambient load.
EC management is one layer of a broader nutrient steering strategy. High-performance growers use EC as a steering signal alongside plant water content readings and substrate dryback percentages to drive generative or vegetative responses at specific growth phases. If you are operating at a scale where that level of control makes sense, the crop steering calculator provides a structured framework for combining irrigation timing, EC, and dryback targets into a unified feeding strategy.
FAQ
What is a safe EC for hydroponic seedlings?
The maximum recommended total reservoir EC for seedlings and fresh clones is 1.2 mS/cm, with most growers targeting 0.6 to 1.0 mS/cm for the first two weeks. This assumes near-zero source water EC. If your tap water contributes 0.4 mS/cm or more, the nutrient EC you can safely add is correspondingly reduced, sometimes to near zero without RO treatment.
What is the difference between the 500 and 700 PPM scale?
Both scales convert an EC reading in mS/cm to an approximate parts-per-million value using a fixed multiplier. The 500 scale (used by Hanna, Milwaukee, and most North American TDS meters) multiplies EC by 500. The 700 scale (used by Bluelab and Truncheon) multiplies by 700. A reading of 1.5 mS/cm produces 750 ppm on a 500-scale meter and 1,050 ppm on a 700-scale meter. Only compare PPM values from meters using the same scale.
Why does my EC stay stable even when I add plain water?
Plants uptake nutrients selectively, consuming certain ions faster than others. Potassium and calcium are typically consumed faster than sulfates or residual bicarbonates from tap water. Over time, the reservoir retains the less-consumed ions while the plant-available fraction drops. EC measures total ion load, not the balance between ions. A stable EC reading after adding plain water likely means ion accumulation is masking nutrient depletion.
At what EC does osmotic pressure reversal occur?
The osmotic reversal threshold is not a single fixed value, as it depends on plant species, root health, and solution temperature. As a working safety limit for most hydroponic crops, total reservoir EC above 3.5 mS/cm carries meaningful reversal risk, and anything above 4.0 mS/cm is considered dangerous for all but salt-tolerant varieties. This calculator flags the threshold at 3.5 mS/cm as a conservative upper bound.
Do I need RO water for hydroponics?
Not universally, but if your source water EC exceeds 0.4 mS/cm, RO filtration removes the dissolved minerals that interfere with nutrient targeting and pH stability. Growers with very low EC well water or consistently clean municipal water below 0.3 mS/cm can often work without RO by adjusting their nutrient dose downward. The critical step is knowing your baseline EC first, not assuming it is acceptable.
Can I use this calculator for soil or coco grows?
The EC formula and safety thresholds in this calculator are designed for recirculating hydroponic systems where the root zone is in direct contact with the reservoir solution. Soil and coco substrate buffer ionic loads differently, and run-to-waste systems have different EC management approaches. The output EC values are still relevant as a starting mix reference, but the lockout and burn thresholds should be adjusted for substrate buffering capacity.
Conclusion
The hydroponic EC calculator on this page forces one calculation that most online guides skip: the source water baseline. Every target EC range, every nutrient label dose, and every PPM recommendation published online assumes near-zero starting conductivity. City tap water, well water, and inadequately maintained RO systems all carry baseline EC that gets added to your nutrient EC whether or not your calculation accounts for it. That uncounted gap is the primary source of undiagnosed nutrient burn, hard water lockout, and baffling osmotic stress in otherwise well-managed systems.
The most important habit this tool reinforces is measurement before mixing. Test source water EC, subtract it from your stage target, and size your nutrient addition to fill the remaining gap rather than hitting a label target blindly. For growers who want to extend this discipline to nutrient dose sizing and reservoir volume calculations, the hydroponic nutrient dosing calculator provides the next layer of precision in the same workflow.
Lead Data Architect
Umer Hayiat
Founder & Lead Data Architect at TheYieldGrid. I bridge the gap between complex agronomic data and practical growing, transforming verified agricultural science into accessible, mathematically precise tools and guides for serious growers.
View all tools & guides by Umer Hayiat →


