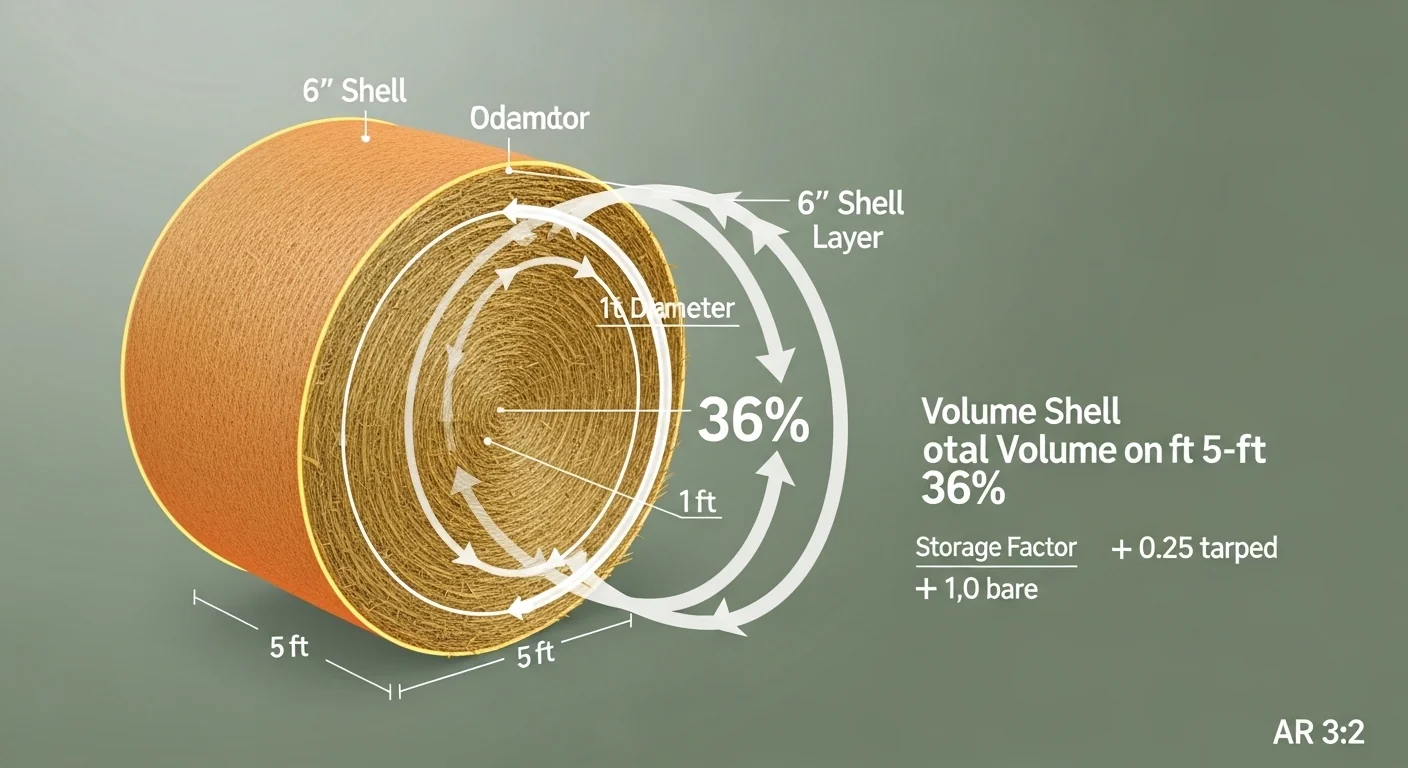
Round bale storage loss is not a surface problem. Farmers who walk the field and see a darkened crust around the outside of a bale tend to estimate 10 to 15 percent gone, maybe less. The actual volumetric math tells a different story. Because a bale is a cylinder, the outer shell holds a disproportionate share of total volume: on a 5-foot-diameter bale, the outer 6-inch layer contains 36 percent of all the hay inside. What looks like a thin weathered rind is nearly a third of what you paid for. That gap between visual estimate and geometric reality is where most storage losses hide.
This calculator takes bale diameter, storage method, storage duration in months, and price per bale to compute dry matter spoilage as a percentage of total bale volume, the financial loss per bale, projected losses across a 100-bale operation, and the split between spoiled and usable cubic footage remaining. It does not account for fermentation-based dry matter loss in wrapped or ensiled bales, regional climate variation, or bale density differences between grass and legume hay. For tracking what your hay costs per animal per day once it reaches the feeding area, the hay cost calculator handles that downstream math.
Bottom line: After running your numbers, you will know whether the cost of a tarp, pallets, or covered storage is smaller than the annual spoilage loss you are already absorbing silently.
Use the Tool
Round Hay Bale Spoilage & Dry Matter Loss Calculator
Expose the hidden volume geometry — know exactly what outdoor storage is really costing you
Warnings & Standards
Reference: Outer-Layer Volume % by Bale Diameter (6-inch spoil shell)
| Bale Diameter | Outer 6″ Vol % | Loss on $80 Bale | Rating |
|---|
Reduce Your Losses — Recommended Storage Solutions
How This Calculator Works
Formula Steps (plain language):
(Assumes standard bale width = 5 ft; a cylinder volume)
SpoiledVol = TotalVol − π × ((Diameter − 1.0) / 2)² × BaleWidth
Adjusted by storage method multiplier (see below)
• Bare Ground: 100% of shell loss
• On Pallets: ~60% of shell loss (bottom protected)
• Tarped: ~25% of shell loss (moisture barrier)
• Barn / Indoor: ~3% (minimal handling/moisture loss only)
(Capped at a max multiplier of 2.0×; barn storage not time-adjusted)
Key Assumption (The “6-Inch Illusion”): A farmer sees the outer crust and assumes only 10% is gone bs� but the volume geometry says otherwise. On a 5-ft bale, the outer 6-inch shell holds ~36% of total volume.
Bale Width Assumption: Standard width of 5 ft used for all calculations. Actual width varies by make; adjust bale price accordingly.
Assumptions & Limits
- Bale width assumed to be 5 ft (standard round bale). Results scale proportionally for different widths.
- The 6-inch outer shell model is a well-documented agronomic estimate for exposed round bale storage (USDA-NRCS, University Extension data).
- Storage method multipliers are agronomic approximations — actual loss varies by climate, humidity, rainfall, and bale density.
- Duration factor is linear beyond month 1; real decay may accelerate in wet climates.
- Barn/indoor storage assumes adequate airflow; mold loss possible in sealed, humid barns.
- Financial loss is calculated on gross bale price; does not account for partial salvage value.
- Calculator does not account for dry matter loss during fermentation in wrapped bales.
- Intended as an estimation tool; consult your local extension service for region-specific loss factors.
[put the tool here]
Before running the calculator, have these four values ready: the measured end-to-end diameter of your bales in feet (not estimated), your storage method, how many months the bales will sit before feeding is complete, and your purchase price per bale. Use the actual measured diameter from one representative bale rather than the rated size on the baler spec sheet, as real-world bale dimensions vary by field conditions and dry matter at baling. If you are also calculating how many bales your herd needs per season, the pasture stocking rate calculator feeds directly into that planning step.
Quick Start (60 Seconds)

- Bale Diameter: Measure end-to-end across the circular face, not the circumference. Accepted range is 2 to 10 feet. Common sizes are 4, 5, and 6 feet. Enter decimals if your bales run 4.5 or 5.5 feet.
- Storage Method: Choose the method that reflects where most bales actually sit, not your best-case scenario. If some bales are tarped and some are not, run two separate calculations.
- Storage Duration: Count months from baling date to when the last bale from that cutting will be consumed, not when feeding starts. Hay sitting in a field for 8 months before you finish it in month 10 is 10 months of exposure.
- Price per Bale: Enter your actual per-bale cost at purchase, including delivery if relevant. Do not use an average across mixed hay quality grades if your high-value hay is stored differently.
- Combo runs: Run the calculator twice to compare scenarios, for example bare ground vs. tarped, to see the dollar gap. The Reset button clears all fields without reloading the page.
- 100-bale projection: The results panel shows the financial exposure across 100 bales automatically. Scale that figure manually for your actual herd inventory.
- Barn storage outlier: If you store in a barn, expect results under 5 percent. The calculator applies a 0.03 shell factor and no duration adjustment for barn storage, reflecting handling and minor moisture change only.
Inputs and Outputs (What Each Field Means)
| Field | Unit | What It Represents | Common Mistake | Safe Entry Guidance |
|---|---|---|---|---|
| Bale Diameter | feet (ft) | End-to-end measurement across the circular bale face. Determines total cylinder volume and the absolute size of the outer spoilage shell. | Entering the baler's nominal setting rather than measuring an actual bale. Bale diameter shrinks with lower dry matter at baling. | Measure 3 to 5 bales and use the average. Accept values from 2 to 10 ft. |
| Storage Method | category | The physical environment where bales are stored. Controls how much of the base 6-inch shell volume is exposed to moisture, UV, and ground contact. | Selecting "Tarped" when tarps are loose, torn, or improperly anchored. An unsealed tarp performs closer to bare ground than to a good tarp installation. | Select the worst-case method for any bales not consistently covered. Use "Barn" only for fully enclosed, ventilated storage. |
| Storage Duration | months | Total months from baling to when the last bale from that batch is fed out. Longer exposure compounds outer-layer decay. | Using the start of feeding rather than the end. If feeding runs from month 4 through month 10, the duration is 10 months, not 4. | Round up to the nearest whole month. Accept values from 1 to 24 months. |
| Price per Bale | USD ($) | Your cost per bale. Used to translate volumetric spoilage percentage into a dollar loss figure for per-bale and per-100-bale reporting. | Using the going market rate rather than your actual invoice price, which may include freight, testing, or quality premiums. | Use the price you actually paid. Accept values from $1 to $10,000. |
| Dry Matter Spoilage % | percent (%) | The share of total bale cylinder volume estimated to be unfit for feeding, based on storage method, outer-shell geometry, and duration. | Treating this as a weight-based figure. It is a volumetric percentage; actual weight loss may differ depending on density. | Output only. No entry required. |
| Financial Loss per Bale | USD ($) | Price per bale multiplied by the spoilage percentage. Represents money paid for hay that cannot be fed. | Ignoring this figure because individual bale loss "seems small." At scale, per-bale losses compound quickly. | Output only. Compare against the annualized cost of a storage upgrade. |
| Loss on 100-Bale Herd | USD ($) | Financial loss per bale multiplied by 100. A standardized scale figure for comparing storage method economics. | Using this figure as a total operation loss without adjusting for actual inventory size. | Output only. Multiply by your actual bale count divided by 100 for your real number. |
| Spoiled Volume | cubic feet (ft³) | Total cubic footage of hay in each bale estimated to have deteriorated to below-threshold dry matter quality. | Conflating this with weight. Volume in cubic feet does not directly equal pounds without a density figure. | Output only. Useful for visualizing physical waste per bale. |
| Good Volume Remaining | cubic feet (ft³) | Usable hay volume per bale after subtracting the spoiled outer shell. Represents what the animal will actually consume. | Assuming all remaining volume is high quality. The boundary between spoiled and usable is gradual, not a hard line. | Output only. Use with caution for ration planning; field testing of hay quality is still recommended. |
Worked Examples (Real Numbers)
Scenario 1: 5-Foot Bales Left on Bare Ground for 6 Months at $80 Each
- Bale Diameter: 5 ft
- Storage Method: Bare Ground
- Storage Duration: 6 months
- Price per Bale: $80
Result: 38.7 percent dry matter spoilage, $30.96 lost per bale, $3,096 projected loss across 100 bales.
Total cylinder volume is 98.2 cubic feet. The outer 6-inch shell (1-foot diameter reduction) holds 35.3 cubic feet, which is 36.0 percent of the bale. With a bare-ground storage factor of 1.0 and a 6-month duration multiplier of 1.075, adjusted spoilage reaches 38.7 percent. At $80 per bale, the 100-bale operation is absorbing more than $3,000 in feed cost for hay that will not reach the animal's mouth.
Scenario 2: 6-Foot Bales Under Tarp for 4 Months at $100 Each
- Bale Diameter: 6 ft
- Storage Method: Tarped on Ground
- Storage Duration: 4 months
- Price per Bale: $100
Result: 8.0 percent dry matter spoilage, $7.94 lost per bale, $794 projected loss across 100 bales.
At 6 feet of diameter, the base shell percentage is 30.6 percent. The tarp storage factor of 0.25 reduces effective exposure to 7.6 percent, and the 4-month duration multiplier of 1.045 brings final spoilage to 8.0 percent. A properly sealed tarp cut the projected 100-bale loss from the bare-ground equivalent of roughly $2,500 down to $794 for this scenario, a gap that covers multiple years of heavy-duty tarp replacement.
Scenario 3: 4-Foot Bales in a Barn for 12 Months at $60 Each
- Bale Diameter: 4 ft
- Storage Method: Barn / Indoor Storage
- Storage Duration: 12 months
- Price per Bale: $60
Result: 1.3 percent dry matter spoilage, $0.79 lost per bale, $79 projected loss across 100 bales.
Indoor storage removes the duration factor from the calculation entirely; barn losses reflect only the 0.03 shell factor applied to base spoilage. Even over 12 months, a 4-foot bale stored inside costs less than $1 in spoilage per bale. The 100-bale projected loss of $79 represents what most outdoor operations lose per bale in a single rain season.
Reference Table (Fast Lookup)
All rows below use 6 months of storage duration. Duration multiplier applied: 1.075 for exposed methods (bare, pallets, tarped). Barn storage uses no duration adjustment. Base price for financial loss column: $80 per bale.
| Bale Diameter (ft) | Storage Method | Base Shell % (geometry only) | Storage Factor | Final Spoilage % (6 months) | Financial Loss at $80/bale |
|---|---|---|---|---|---|
| 4 | Bare Ground | 43.8% | 1.00 | 47.1% | $37.63 |
| 4 | Tarped | 43.8% | 0.25 | 11.8% | $9.41 |
| 5 | Bare Ground | 36.0% | 1.00 | 38.7% | $30.96 |
| 5 | On Pallets | 36.0% | 0.60 | 23.2% | $18.58 |
| 5 | Tarped | 36.0% | 0.25 | 9.7% | $7.74 |
| 5 | Barn / Indoor | 36.0% | 0.03 | 1.1% | $0.86 |
| 6 | Bare Ground | 30.6% | 1.00 | 32.9% | $26.32 |
| 6 | On Pallets | 30.6% | 0.60 | 19.7% | $15.77 |
| 6 | Tarped | 30.6% | 0.25 | 8.2% | $6.57 |
| 7 | Bare Ground | 26.5% | 1.00 | 28.5% | $22.82 |
Notice that the base shell percentage drops as diameter increases. Larger bales are more storage-efficient per unit volume because the outer shell is a smaller fraction of the whole cylinder. That geometric advantage does not disappear in outdoor storage, but it shrinks the proportional benefit unless storage method improves alongside bale size.
How the Calculation Works (Formula + Assumptions)
Show the calculation steps
Step 1: Total Cylinder Volume
TotalVolume = pi multiplied by (Diameter divided by 2) squared, multiplied by BaleWidth
BaleWidth is assumed to be 5 feet (standard round bale). Result is in cubic feet.
Step 2: Inner Cylinder Volume
The outer 6-inch (0.5-foot) layer on each side removes 1 full foot from the diameter.
InnerVolume = pi multiplied by ((Diameter minus 1.0) divided by 2) squared, multiplied by BaleWidth
If InnerDiameter falls to zero or below (very small bales), InnerVolume is treated as zero.
Step 3: Base Spoilage Volume and Percentage
SpoiledVolume = TotalVolume minus InnerVolume
BaseSpoilagePct = (SpoiledVolume divided by TotalVolume) multiplied by 100
Step 4: Storage Method Adjustment
The base shell percentage is multiplied by a storage factor that reflects how much of the shell is actually exposed to decay conditions:
- Bare Ground: factor 1.00 (full exposure)
- On Pallets: factor 0.60 (bottom protected, sides and top exposed)
- Tarped: factor 0.25 (moisture barrier in place, minor infiltration accounted for)
- Barn / Indoor: factor 0.03 (only handling and minor moisture change)
Step 5: Duration Adjustment
For all storage methods except barn/indoor, a duration multiplier is applied when duration exceeds 1 month:
DurationMultiplier = 1 + ((Months minus 1) multiplied by 0.015)
This multiplier is capped at 2.0, which corresponds to approximately 68 months of continuous exposure.
Barn storage receives no duration adjustment.
Step 6: Final Spoilage Percentage
FinalSpoilagePct = BaseSpoilagePct multiplied by StorageFactor multiplied by DurationMultiplier
This result is capped at 95 percent.
Rounding rule: displayed to one decimal place in all output fields.
Step 7: Financial Outputs
LossPerBale = PricePerBale multiplied by (FinalSpoilagePct divided by 100)
Loss100Bales = LossPerBale multiplied by 100
Good volume = TotalVolume minus (TotalVolume multiplied by FinalSpoilagePct divided by 100)
Assumptions and Limits
- Bale width is assumed to be 5 feet for all calculations. This is the standard round bale width for common 5x5 and 6x5 configurations. Narrow or non-standard bales will produce proportionally different financial figures because total volume scales with width, though spoilage percentage is width-independent.
- The 6-inch outer shell is a widely-used agronomic approximation for exposed round bale decay depth. In high-rainfall climates or with prolonged direct water contact, actual penetration depth can exceed this figure.
- Storage method factors (1.00, 0.60, 0.25, 0.03) are composite approximations. Actual loss variation within each method category can be substantial depending on tarp quality, tarp anchoring, pallet type, drainage, and prevailing humidity.
- The duration factor is linear at 1.5 percent per month beyond month 1. Real-world decay may accelerate after extended periods of wet weather or after tarp failure, and the linear model will underestimate losses in those conditions.
- The calculator treats the spoilage boundary as a discrete shell. In practice, quality grades out gradually from the outer surface inward, so the "good" volume estimate should be used for planning purposes rather than precise ration formulation.
- Wrapped or ensiled bales experience fermentation-based dry matter loss that this model does not capture. Do not apply these outputs to baleage or haylage products.
- Dry matter loss and weight loss are related but not identical. Spoilage percentage here is volumetric. If your operation tracks feed by weight, the volumetric figure is directionally correct but not substitutable for a scale-based measurement.
- This tool does not adjust for hay species (alfalfa vs. grass vs. mixed), bale density, or initial moisture content at baling, all of which affect real-world spoilage rates.
Standards, Safety Checks, and "Secret Sauce" Warnings
Critical Warnings
- The 6-Inch Illusion: A visual inspection of bale surface decay is not a valid method for estimating volume loss. On a 4-foot bale, the outer 6-inch shell holds 43.8 percent of total hay volume. A farmer who estimates "10 percent gone" by looking at the surface may actually be losing four times that in cubic feet. This is the single most common source of cost underestimation in round bale storage management.
- Pallet Storage Is Not Low-Loss Storage: Elevating bales on pallets protects the bottom face from ground moisture but leaves the top and sides fully exposed. The 60 percent storage factor reflects that reality. At 6 months with 5-foot bales, pallet storage still projects 23 percent spoilage under this model, more than double what tarped storage produces.
- Duration Compounds Exposure: Each month of outdoor storage adds incremental loss. A bale that feeds animals in month 4 of an 8-month storage window has already absorbed 7 months of weather exposure by the time the last bale is consumed. Calculating duration from baling date to final feeding date, not feeding start date, is the accurate approach.
- Loose or Torn Tarps Approach Bare Ground Performance: A tarp that lifts in wind, pools water at the center, or has tears along seams provides far less protection than the 0.25 factor assumes. If tarp maintenance is inconsistent, use the "On Pallets" setting as a conservative estimate rather than "Tarped."
Minimum Standards
- Round bale storage on any exposed surface for more than 3 months should be treated as a high-loss scenario by default. The duration multiplier reaches 1.045 at 4 months and 1.075 at 6 months; losses that begin at a manageable 10 percent can cross 15 percent without a storage method change.
- A spoilage result below 10 percent is considered acceptable for planning purposes. Results between 10 and 20 percent warrant a storage method review. Results above 20 percent indicate a storage infrastructure problem that carries a direct annual cost likely to exceed one-time storage improvement investments.
- Barn or covered storage is the only method in this model that removes the duration penalty entirely, reflecting field data showing that properly ventilated indoor storage limits losses to the 2 to 5 percent range regardless of storage length. Adequate ventilation matters: closed, humid barns can produce mold conditions that the barn factor does not capture. For sizing barn airflow requirements, the barn ventilation calculator covers that step.
Competitor Trap: Most articles on round bale spoilage express loss as a single generic number, something like "outdoor storage causes 5 to 30 percent dry matter loss." That range is not actionable because it does not account for bale diameter, specific storage method, duration, or financial scale. A 4-foot bale stored on bare ground for 8 months in a wet climate and a 7-foot bale tarped for 3 months in an arid region are not comparable events, yet most published guidance treats them identically. This calculator forces each variable to be explicit and produces results derived from actual cylinder geometry rather than averaged survey data. The gap between "somewhere in the range" and a computed dollar figure is the gap between noticing a problem and fixing it.
Planning how much hay to purchase given known or projected spoilage losses connects directly to winter feed budgeting. The winter cattle feed calculator lets you build that inventory plan with spoilage-adjusted consumption figures.
Common Mistakes and Fixes
Mistake: Measuring Bale Diameter from Memory or Baler Settings
Baler settings represent a target diameter, not a guarantee. Field conditions, hay species, and moisture content all affect the actual bale that rolls out. A baler set for 5 feet can produce bales ranging from 4.6 to 5.2 feet in diameter, which changes total volume by more than 20 percent and shifts the outer-shell percentage meaningfully. Fix: Measure three to five representative bales with a tape measure and average the results before entering diameter.
Mistake: Calculating Storage Duration from Feeding Start Rather than Feeding End
If 100 bales go into the field in July and the last bale is consumed in April, total storage duration is 9 months, not the 2 or 3 months it takes to work through the inventory during feeding season. Every bale purchased experiences the full duration from baling to its own consumption date. The average-case calculation requires thinking about the last bale in the stack, not the first. Fix: Use baling date to last-bale consumption date as the duration input, or run the calculator twice using minimum and maximum exposure durations and average the results.
Mistake: Selecting "Tarped" When Tarp Installation Is Inconsistent
The 0.25 storage factor for tarped hay assumes a tarp that is properly anchored, sealed at the base, and maintained throughout the storage period. Real tarp performance varies considerably. A tarp that blows off in a wind event and is not replaced for two weeks has provided near-zero protection during that window. Operators who tarp informally or without anchoring hardware often see results closer to pallet-storage than to true tarp performance. Fix: Use the "On Pallets" setting as a conservative proxy if tarp installation and maintenance are not consistent. Upgrade to anchored installations if the dollar gap justifies it.
Mistake: Treating per-Bale Loss as Too Small to Address
A loss of $18 per bale on a 5-foot bale stored on pallets sounds tolerable in isolation. Multiplied across a 200-bale operation, the same loss rate produces $3,600 per year in feed paid for but not consumed. The 100-bale projection in this calculator is a standardized comparison tool; scale it by actual inventory to see the true annual figure. Efficient feed management also improves feed conversion ratios at the herd level, making every dollar of purchased hay go further. Fix: Run the full-year inventory calculation before deciding whether a storage upgrade investment is justified.
Mistake: Applying This Model to Wrapped Baleage or Haylage
The outer-shell spoilage model describes aerobic surface decay in dry round bales exposed to rain, UV, and ground moisture. Wrapped bales stored as baleage undergo anaerobic fermentation with a fundamentally different loss mechanism. Applying the bare-ground or tarp factors to wrapped bale storage will produce inaccurate results. Loss characteristics of ensiled forages depend on fermentation pH, oxygen infiltration at wrap punctures, and feeding management at face removal. The silage bunker capacity calculator covers the ensiled forage side of this planning question. Fix: Use this calculator only for dry round bales intended for direct feeding, not wrapped or ensiled products.
Next Steps in Your Workflow
Once you have the spoilage percentage and financial loss figure, the immediate decision is whether a storage method change pays for itself. A set of heavy-duty hay tarps with screw-in anchors for a 100-bale pad costs roughly one to two times what bare-ground storage loses in a single season for a mid-size operation. The calculator result gives you the annual loss baseline. Compare that directly against the annualized cost of storage infrastructure over its expected useful life. That comparison is the single most actionable thing you can do with this output today.
The second downstream question is how spoilage affects your total feed inventory requirements for the season. If 20 percent of every bale is going to spoilage, you need to purchase 25 percent more hay than a simple head-count ration calculation would suggest in order to cover actual dry matter delivery to the animal. Accurate per-head feed cost planning, adjusted for spoilage loss, is something the feed cost calculator handles once you have a confirmed spoilage percentage. Similarly, if your operation runs on rotational grazing and you are managing stockpiled forage alongside purchased hay, the rotational grazing calculator helps balance field forage against stored hay requirements through the winter period.
FAQ
What is a realistic dry matter loss percentage for outdoor round bale storage?
Published agronomic ranges typically run from 5 percent for well-tarped bales in dry climates to over 40 percent for large-diameter bales on bare ground in high-rainfall regions. The actual figure depends on bale diameter, storage method, duration, and local weather patterns. This calculator computes a specific estimate for your inputs rather than applying a generic range.
Does bale diameter actually affect spoilage percentage?
Yes, and significantly. Because total volume scales with the square of the radius, larger-diameter bales have a smaller proportion of total volume in the outer 6-inch shell. A 4-foot bale has 43.8 percent of its volume in that shell. A 7-foot bale has 26.5 percent. Larger bales are inherently more storage-efficient per unit volume, which is one reason equipment manufacturers moved toward larger bale configurations over time.
Why does the calculator assume a 5-foot bale width?
The 5x5 and 6x5 configurations are the two most common round bale dimensions in North American hay production. Bale width affects total volume and therefore total financial loss in dollar terms, but it does not change spoilage as a percentage of the bale because the same outer-shell percentage applies regardless of width. The 5-foot assumption is a conservative default for financial projections.
How does tarping reduce spoilage so substantially compared to bare ground?
Most outer-shell decay in exposed round bales is driven by moisture infiltration: rain wets the surface, capillary action pulls moisture inward, and fungal activity follows available water. A properly sealed tarp eliminates most of that moisture exposure. The model applies a 0.25 factor, meaning tarped bales are estimated to experience 25 percent of the decay that bare-ground bales would at equivalent diameter and duration.
Is the 6-inch spoilage shell assumption consistent with university extension research?
The 6-inch outer layer as the primary zone of decay is referenced in USDA-NRCS guidance and various state extension publications covering round bale storage. Actual penetration depth varies by climate, hay species, and the nature of moisture exposure. The 6-inch figure is a reasonable conservative estimate for temperate conditions with normal seasonal rainfall, not an absolute biological threshold.
Can I use this calculator for square bales?
No. The spoilage model uses cylinder geometry specific to round bales. Square and rectangular bales have different surface-area-to-volume ratios and different decay patterns. The 6-inch outer-shell approach does not translate directly to rectangular bale geometry. A separate calculation accounting for the actual dimensions of square or three-string bales would be needed.
Conclusion
The central insight this calculator delivers is not a number: it is a reframing of what outdoor hay storage actually costs. The 6-inch spoilage shell looks modest from the outside. Geometrically, it holds a third to nearly half of total bale volume depending on diameter. That gap between visual perception and volumetric reality is where thousands of dollars of purchased hay disappear from operations every year, silently, without a line item on any budget report.
The most important mistake to avoid is estimating storage loss by eye. Enter real numbers into the calculator, see the financial figure that results, and compare it against the one-time cost of a storage upgrade. If you are working through how to allocate hay inventory across different parts of your operation, the hay cost calculator connects per-bale cost and spoilage-adjusted dry matter delivery into a per-animal daily feed cost figure that completes the budget picture.
Lead Data Architect
Umer Hayiat
Founder & Lead Data Architect at TheYieldGrid. I bridge the gap between complex agronomic data and practical growing, transforming verified agricultural science into accessible, mathematically precise tools and guides for serious growers.
View all tools & guides by Umer Hayiat →