The number printed on a reverse osmosis membrane is a lab measurement, not a field guarantee. It was captured at 77°F and exactly 65 PSI using test water that bears little resemblance to a cold well, a low-pressure municipal line, or a chlorinated feed on a summer afternoon. When conditions drift from that reference point, membrane flux changes predictably according to physics, not luck. Understanding that relationship is the difference between sizing your system correctly and running out of filtered water while your brine line flushes nonstop.
This calculator applies two correction factors, temperature and pressure, to your membrane’s rated GPD (gallons per day) and returns the actual daily production you can expect under real conditions. It also computes how many gallons of brine (waste water) your system will reject for a given target yield, using the standard 20% recovery assumption common to single-pass residential and light agricultural RO systems. It does not model TDS salt rejection, membrane fouling, osmotic back-pressure from high-salinity sources, or multi-pass commercial configurations.
Once you see your corrected GPD, you can determine whether your current membrane size, water temperature, and line pressure can actually meet your daily demand, or whether a booster pump, a larger membrane, or a different source water strategy is the more direct fix.
Use the Tool
RO Membrane Flux & Brine Ratio Calculator
Calculate your actual RO output based on water temperature and pressure — and see exactly how much water goes down the drain.
How This Calculator Works
RO membranes are lab-rated at exactly 77°F (25°C) and 65 PSI. Real-world conditions almost always differ — and the physics of membrane flux means performance degrades significantly with colder, lower-pressure water.
Step 1: Temperature Correction Factor (TCF)
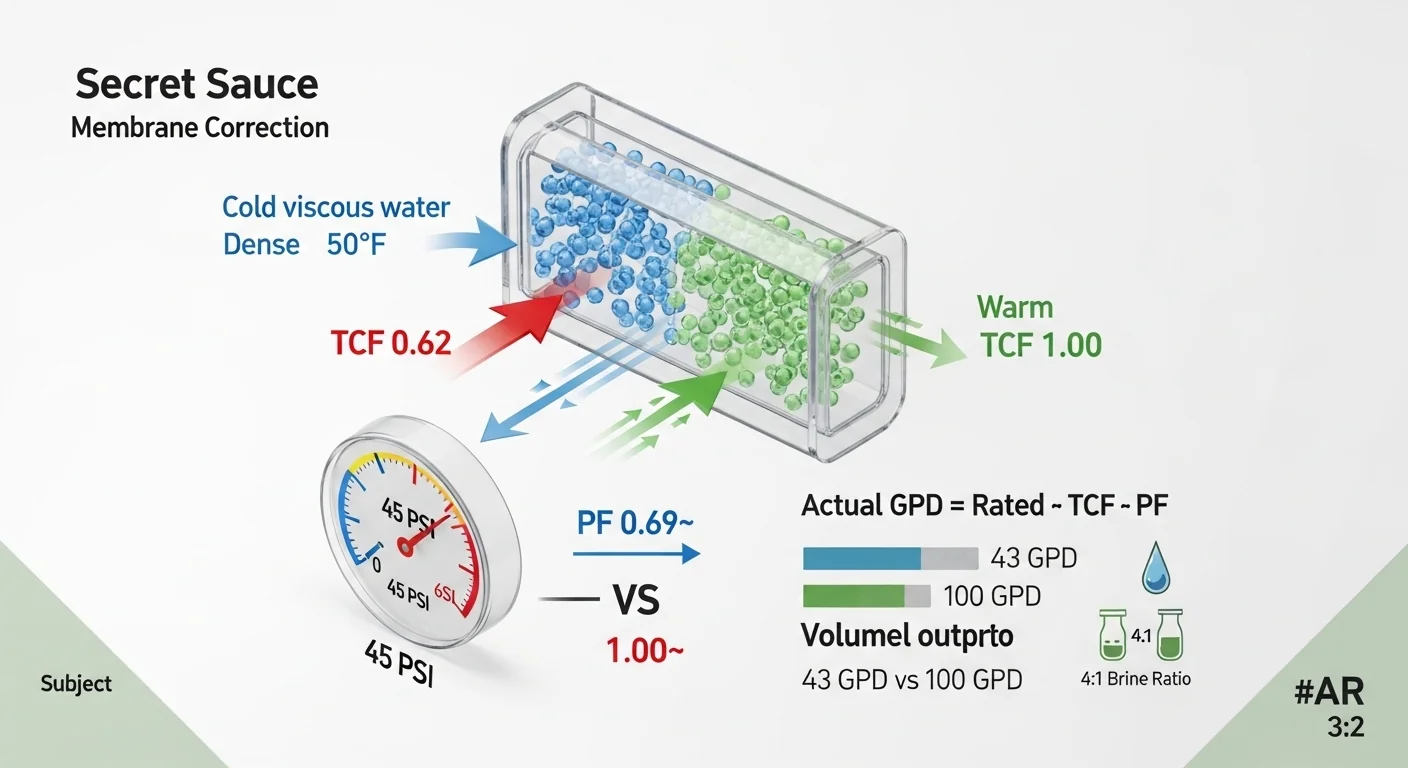
Water viscosity increases as temperature drops, forcing the membrane to work harder to pass the same volume. TCF is calculated using the Van’t Hoff membrane correction model:
where °C = (°F − 32) × 5/9. At 77°F, TCF = 1.00. At 50°F, TCF ≈ 0.58 — a 42% drop in membrane throughput.
Step 2: Pressure Factor
Flux scales linearly with applied pressure relative to the rated operating pressure of 65 PSI:
Step 3: Actual Daily Production
Step 4: Brine (Waste Water) Calculation
Standard residential RO systems operate at approximately 20% recovery — meaning for every 1 gallon of pure water produced, 4 gallons of brine (concentrate) is sent to drain.
Why this matters: A grower relying on a 100 GPD system in 50°F winter well water may only receive ~40 GPD of actual output — while tripling their water bill due to increased brine rejection time and continuous flush cycles.
Assumptions & Limits
- Membrane ratings assume 77°F (25°C) and 65 PSI feed conditions per ANSI/NSF Standard 58.
- Recovery rate is fixed at 20%, typical for single-pass residential systems without a permeate pump or recirculation loop.
- Commercial systems with recirculation or high-pressure pumps can achieve 50–75% recovery — this calculator does not model those configurations.
- TDS, salt rejection, and membrane fouling are not modeled. Fouled or scaling membranes perform worse than this calculator predicts.
- Pressure assumes net driving pressure equals feed PSI (osmotic back-pressure is not subtracted; for brackish or high-TDS feeds, actual output will be lower).
- Temperature range: 32°F–113°F (0°C–45°C). Below 32°F the feed water is frozen; above 113°F most thin-film composite membranes are damaged.
- This tool is for educational estimation. Verify with your membrane manufacturer’s published flux tables.
Before running the calculation, have four numbers ready: the GPD rating printed on your membrane housing or packaging, your feed water temperature in Fahrenheit (a simple aquarium thermometer in the supply line works well), your static line pressure in PSI (a saddle gauge on the feed line before the pre-filters gives the most accurate reading), and the number of gallons of pure water you need the system to produce each day. If your pressure fluctuates, use the lower end of the range for a conservative estimate. For growers monitoring system pressure across multiple zones, the well pressure tank calculator can help verify whether the tank and pump combination is sustaining adequate pressure at the membrane inlet.
Quick Start (60 Seconds)
- Membrane Rating (GPD): Use the number printed on the membrane label, such as 50, 75, 100, or 150 GPD. This is the manufacturer's rated output at 77°F and 65 PSI, not your real-world output. Do not enter a value based on what your system produced last month.
- Feed Water Temperature (°F): Measure at the point of entry, not at the tap or tank. Well water in northern climates commonly sits between 45°F and 55°F in winter. Municipal tap water typically ranges from 55°F to 75°F depending on season. Entering 77°F when your water is actually 52°F will make results meaningless.
- Feed Water Pressure (PSI): Measure upstream of your pre-filters, not downstream. A clogged sediment filter can drop pressure by 10 to 20 PSI before the feed ever reaches the membrane. The rated reference is 65 PSI. If you are unsure, 40 to 50 PSI is a common residential low-pressure situation.
- Target Pure Water Yield (Gallons): Enter how many gallons of filtered permeate you need per day. This is the number your tank needs to fill, not a rough estimate. The waste water output is calculated from this number, so precision here matters for understanding your brine volume.
- Unit check: All temperature entries must be in Fahrenheit, not Celsius. Pressure must be in PSI, not bar or kPa. Membrane rating must be in GPD, not liters per day.
- Run the calculation before changing hardware: Many growers replace a membrane when the real constraint is low pressure or cold feed water. Let the corrected GPD tell you what is actually limiting your system before purchasing parts.
Inputs and Outputs (What Each Field Means)
| Field Name | Unit | What It Represents | Common Mistake | Safe Entry Guidance |
|---|---|---|---|---|
| Membrane Rating (GPD) | GPD | Manufacturer-rated daily permeate output under standard lab conditions (77°F, 65 PSI) | Entering actual observed output instead of the label rating | Read the value directly off the membrane housing or spec sheet; valid range is 1 to 10,000 GPD |
| Feed Water Temperature | °F | Temperature of the incoming feed water at the membrane inlet | Using room temperature or tap discharge temperature instead of supply-line temperature | Measure with a thermometer in the feed line; valid range 32°F to 113°F |
| Feed Water Pressure | PSI | Static line pressure delivered to the membrane after pre-filters | Reading pressure before a clogged sediment filter, inflating the true membrane feed pressure | Measure downstream of pre-filters; rated reference is 65 PSI; valid range 10 to 300 PSI |
| Target Pure Water Yield | Gallons | The volume of filtered permeate the system needs to produce per day | Entering tank capacity rather than actual daily consumption | Use daily demand, not storage volume; valid range 0.1 to 10,000 gallons |
| Actual GPD Output (result) | GPD | Corrected daily production after applying temperature and pressure factors | Confusing this with the tank fill rate, which also depends on system run time and auto-shutoff | Compare this number directly to your daily demand to determine adequacy |
| Temp Correction Factor (TCF) | Dimensionless | Multiplier applied to rated GPD to account for water viscosity change with temperature | Assuming TCF is linear; it follows an exponential decay function | Values below 0.65 indicate severe thermal performance loss; values above 1.0 indicate warm-water gains |
| Pressure Factor | Dimensionless | Ratio of actual PSI to the 65 PSI rated reference, applied as a linear multiplier | Assuming pressure loss is negligible at 50 PSI vs. 65 PSI (it removes roughly 23% of output) | Values below 0.70 indicate the membrane is significantly underpressured |
| Waste Water (Brine) | Gallons | Volume of concentrate rejected to drain to produce the target yield at 20% recovery | Assuming brine volume is fixed regardless of target yield; it scales directly with yield | At 20% recovery, brine is always 4 times the target yield volume |
| Brine Ratio | Ratio (x:1) | Gallons of brine discharged per gallon of pure water produced | Comparing this to commercial RO ratios; residential 20% recovery systems always produce a 4:1 ratio | A permeate pump or recirculation loop can reduce this ratio; not modeled here |
Worked Examples (Real Numbers)
Scenario 1: Winter Well Water with Low Pressure
- Membrane Rating: 100 GPD
- Feed Water Temperature: 50°F (10°C)
- Feed Water Pressure: 45 PSI
- Target Pure Water Yield: 20 gallons/day
TCF = exp[2640 × (1/298.15 − 1/283.15)] = 0.625
Pressure Factor = 45 ÷ 65 = 0.692
Actual GPD = 100 × 0.625 × 0.692 = 43.2 GPD
Waste Water = 20 × 4 = 80 gallons/day to drain
Result: 43.2 GPD actual output, 80 gallons brine. The system is producing less than half its rated capacity. Cold water viscosity removed 37.5% of rated flux before pressure losses were even applied. A booster pump alone cannot fully compensate for the thermal deficit at this temperature.
Scenario 2: Ideal Lab Conditions (Baseline Reference)
- Membrane Rating: 75 GPD
- Feed Water Temperature: 77°F (25°C)
- Feed Water Pressure: 65 PSI
- Target Pure Water Yield: 15 gallons/day
TCF = exp[2640 × (1/298.15 − 1/298.15)] = 1.000
Pressure Factor = 65 ÷ 65 = 1.000
Actual GPD = 75 × 1.000 × 1.000 = 75.0 GPD
Waste Water = 15 × 4 = 60 gallons/day to drain
Result: 75.0 GPD, 60 gallons brine. This is the only scenario where rated output matches real output. It exists primarily to establish the reference baseline; most real installations deviate from it.
Scenario 3: Summer Tap Water at Reduced Pressure
- Membrane Rating: 150 GPD
- Feed Water Temperature: 68°F (20°C)
- Feed Water Pressure: 50 PSI
- Target Pure Water Yield: 30 gallons/day
TCF = exp[2640 × (1/298.15 − 1/293.15)] = 0.858
Pressure Factor = 50 ÷ 65 = 0.769
Actual GPD = 150 × 0.858 × 0.769 = 99.0 GPD
Waste Water = 30 × 4 = 120 gallons/day to drain
Result: 99.0 GPD, 120 gallons brine. Even at a comfortable 68°F, a 15 PSI pressure shortfall reduces output by roughly one third relative to rated. The system would still meet the 30-gallon daily demand with substantial headroom, but the brine load of 120 gallons per day is worth factoring into well yield or municipal water cost calculations.
Reference Table (Fast Lookup)
All values assume a 100 GPD rated membrane. Scale proportionally for other ratings (e.g., multiply by 0.75 for a 75 GPD membrane, by 1.5 for 150 GPD). The "Output % of Rated" column shows the combined efficiency at each pressure. Waste water per 10 gallons of target yield is fixed at 40 gallons (20% recovery) regardless of temperature or pressure.
| Temp (°F) | Temp (°C) | TCF | Actual GPD @ 65 PSI | Actual GPD @ 50 PSI | Actual GPD @ 40 PSI |
|---|---|---|---|---|---|
| 50 | 10.0 | 0.625 | 62.5 | 48.1 | 38.5 |
| 55 | 12.8 | 0.684 | 68.4 | 52.6 | 42.1 |
| 60 | 15.6 | 0.748 | 74.8 | 57.5 | 46.0 |
| 65 | 18.3 | 0.816 | 81.6 | 62.8 | 50.2 |
| 68 | 20.0 | 0.858 | 85.8 | 66.0 | 52.8 |
| 77 (rated) | 25.0 | 1.000 | 100.0 | 76.9 | 61.5 |
| 85 | 29.4 | 1.138 | 113.8* | 87.5 | 70.0 |
| 95 | 35.0 | 1.333 | 133.3* | 102.6 | 82.1 |
* Values above rated GPD are mathematically valid for the correction formula but may be limited by membrane salt passage constraints at elevated temperatures. Verify with your membrane manufacturer's published flux data above 85°F.
How the Calculation Works (Formula + Assumptions)

Show the calculation steps
Step 1: Convert temperature to Celsius
°C = (°F − 32) × 5 ÷ 9
This is required because the TCF formula uses absolute temperature in Kelvin.
Step 2: Calculate the Temperature Correction Factor (TCF)
TCF = exp[ 2640 × ( 1/298.15 − 1/(°C + 273.15) ) ]
The constant 2640 is derived from the activation energy of water transport through thin-film composite polyamide membranes using the Van't Hoff/Arrhenius relationship. The reference temperature of 298.15 K corresponds to 77°F (25°C). A TCF of 1.000 at that temperature confirms the formula is anchored to the manufacturer rating point.
Step 3: Calculate the Pressure Factor
Pressure Factor = Current PSI ÷ 65
RO membrane flux scales approximately linearly with net driving pressure. The 65 PSI reference is the ANSI/NSF Standard 58 test condition. This model does not subtract osmotic back-pressure; for high-TDS feeds or brackish water, actual flux will be lower than this formula predicts.
Step 4: Calculate Actual GPD
Actual GPD = Rated GPD × TCF × Pressure Factor
Rounding: results are displayed to one decimal place. No intermediate values are rounded; rounding occurs only at the final output step.
Step 5: Calculate Brine (Waste Water) Volume
Recovery = 20% (fixed assumption for standard residential single-pass systems)
Waste Water (gal) = Target Yield × ( (100 − 20) ÷ 20 ) = Target Yield × 4
Brine Ratio = 4:1 (four gallons of concentrate rejected per gallon of permeate produced)
Assumptions and Limits
- The rated GPD entered must reflect the manufacturer's 77°F / 65 PSI laboratory standard, per ANSI/NSF Standard 58 test protocols. Ratings printed on non-certified membranes may use different test conditions.
- Recovery rate is fixed at 20%, which is standard for single-pass residential systems without a permeate pump, bladder tank, or recirculation loop. Commercial or agricultural systems with auxiliary pressure equipment routinely achieve 40 to 75% recovery, which would reduce the brine ratio significantly.
- The pressure factor assumes net driving pressure equals feed PSI. For high-TDS source water (above 500 ppm), osmotic back-pressure is non-trivial and will further reduce actual output beyond what this calculator shows.
- Membrane fouling, scaling, and bio-film accumulation are not modeled. A membrane operating past its recommended service interval, or on high-hardness water without adequate pre-treatment, will underperform even the corrected GPD estimate.
- Temperature limits are 32°F (0°C) to 113°F (45°C). Below freezing the feed water is solid; above 113°F most thin-film composite polyamide membranes suffer permanent polymer deformation and rejection loss.
- Pre-filter pressure drop is not modeled. If pre-filters (sediment, carbon block) are loaded or partially clogged, actual membrane feed pressure may be substantially lower than the gauge reading upstream of those filters.
- Salt rejection percentage is not calculated. This tool addresses volume and efficiency, not water quality or TDS output.
Standards, Safety Checks, and "Secret Sauce" Warnings
Critical Warnings
- The Cold Water Choke is multiplicative, not additive. At 50°F, the TCF penalty alone removes roughly 37.5% of rated output. If feed pressure is simultaneously low (say, 45 PSI instead of 65 PSI), the pressure factor removes an additional 31% on top of what remains. A 100 GPD membrane under both conditions may deliver fewer than 44 gallons per day, driving brine cycles that can triple a water bill without visible warning.
- Replacing a membrane is rarely the fix for underperformance. A new 100 GPD membrane installed at 50°F and 45 PSI will produce the same 43 GPD as the old one. The membrane is performing exactly as physics dictates. Correcting temperature or pressure first, then assessing whether membrane replacement is actually warranted, avoids unnecessary hardware costs.
- Brine volume increases with target yield, not with feed conditions. Lowering temperature or pressure reduces how fast pure water is produced, but it does not change how much brine is rejected per gallon of permeate at 20% recovery. A system forced to run longer to fill a tank still sends four gallons to drain for every gallon captured, compounding water cost with extended run time.
- Pre-filter pressure drop is invisible without a downstream gauge. Growers who read pressure at the wall supply line and assume that value reaches the membrane are often working with 10 to 25 PSI less at the membrane inlet than the gauge shows. This gap explains many cases of unexpectedly low production that appear unrelated to temperature.
Minimum Standards
- ANSI/NSF Standard 58 requires membrane flux ratings to be measured at 77°F (25°C) and 65 PSI. Any GPD rating published under different conditions is not comparable without correction.
- A booster pump is generally required to maintain consistent performance when static line pressure is below 50 PSI. The Aquatec series and equivalent permeate-pump configurations are commonly used in residential and light agricultural installations for this purpose.
- Feed water temperature should be measured directly in the supply line, not estimated from seasonal averages, when sizing a system for year-round operation. Winter low-temperature conditions determine the membrane size required to meet peak demand.
Competitor Trap: Most RO sizing guides list membrane GPD ratings and stop there, treating the label number as the delivery number. This produces undersized systems in cold climates and overstated performance claims from manufacturers who benefit from that confusion. The TCF correction is well-established in membrane science and is referenced in NSF test methodology, but it almost never appears in consumer-facing calculators or product listing descriptions. Growers who discover this gap after installation, typically when winter production collapses, are left troubleshooting a correctly functioning membrane.
For installations where RO output feeds a drip or micro-irrigation system, sizing the irrigation pump and feed line to match corrected (not rated) GPD is critical. The irrigation pump sizing calculator can help verify whether downstream delivery infrastructure is matched to actual production capacity rather than the label specification.
Water quality going into the RO system also affects how hard the membrane works over time. High sediment loads accelerate pre-filter loading and reduce membrane feed pressure faster than anticipated. Understanding source-water behavior, including the soil infiltration rate for surface-collected feed water, can inform pre-treatment decisions before water reaches the membrane.
Common Mistakes and Fixes
Mistake: Reading pressure at the wall supply, not at the membrane inlet
A pressure gauge on the cold water supply line before pre-filters captures the full line pressure. Sediment and carbon block pre-filters typically consume 5 to 15 PSI when partially loaded. By the time feed water reaches the membrane, available pressure may already fall below the minimum threshold for adequate flux. This creates a phantom underperformance problem that looks like membrane degradation but is actually a filter maintenance issue.
Fix: Install a low-cost saddle gauge or test port on the feed line between the last pre-filter and the membrane housing, and check it monthly.
Mistake: Sizing the system on summer temperature data for year-round use
Well water temperature in cold climates can swing from 55°F in late summer to 44°F in January. A system sized to produce 80 GPD in August may deliver fewer than 50 GPD in winter using the same membrane and pressure. If year-round production targets are fixed, the sizing calculation must use the lowest expected feed temperature, not an annual average or peak-season reading.
Fix: Run the calculator at the coldest expected feed temperature and size the membrane or supplemental heating to that scenario. The reference table above shows exact TCF values for common cold-water temperatures.
Mistake: Ignoring brine volume in water budget planning
At 20% recovery, producing 50 gallons of filtered water requires 250 gallons of feed water total, with 200 gallons discharged as brine. For operations on metered municipal water or limited well yield, this ratio can represent a substantial hidden cost that was not part of the original system budget. Growers sometimes notice elevated water bills without connecting the increase to extended brine flush cycles caused by cold-weather underperformance.
Fix: Calculate total feed water demand (target yield ÷ 0.20) and compare it against available daily supply or well recovery rate before installation. Pair RO planning with rainwater collection estimates where supplemental feed sources are available.
Mistake: Replacing the membrane when the recovery rate is the real bottleneck
Standard single-pass residential membranes are limited to roughly 20% recovery by design, not by age or condition. A membrane replaced after two years at 20% recovery will perform identically to the new one at 20% recovery under the same conditions. Operators who expect recovery to improve after membrane replacement are addressing the wrong variable entirely.
Fix: Upgrade to a permeate-pump or recirculation configuration, which can push recovery to 30 to 50%, rather than replacing the membrane on a cycle that does not address the structural limitation.
Mistake: Treating the TCF formula as linear across temperature
Some simplified RO guides suggest a flat rule of thumb such as "output drops 2% per degree below 77°F." The actual TCF formula is exponential. The performance gap between that linear approximation and the real correction factor grows substantially below 60°F, causing planners to overestimate cold-weather output and undersize storage or backup capacity.
Fix: Use a formula-based tool like this one rather than rule-of-thumb tables for any installation where cold-season performance is critical. The reference table above shows exactly where linear approximations break down relative to the Van't Hoff-derived TCF.
Next Steps in Your Workflow
Once you have your corrected GPD number, the immediate decision is whether it meets your peak daily demand with enough margin to account for auto-shutoff pressure delays and storage tank lag. If actual GPD falls short, the table of temperature and pressure scenarios makes it straightforward to determine which lever, added pressure or warmer feed, closes the gap faster. In most cold-climate cases, a booster pump delivering 80 PSI instead of 45 PSI will recover more output than any other single intervention, and the cost is typically a fraction of a larger membrane upgrade. If the system is producing adequate permeate but the brine volume is creating well yield or water cost problems, the next step is evaluating a permeate pump or closed-loop recirculation upgrade to push recovery above 20%.
For growers using RO-treated water in precision drip or fertigation systems, the daily production volume should be cross-checked against actual irrigation demand before programming controller run times. An RO system that produces 60 GPD but serves a crop with a 75-gallon daily water requirement will run perpetual deficit cycles unless storage capacity buffers the gap. The drip irrigation run time calculator helps translate daily water volume requirements into scheduled run times, and the hose flow rate calculator can verify that the delivery lines between your storage tank and irrigation zones are sized to move that volume without flow restriction during peak demand periods.
FAQ
Why does my 100 GPD membrane only produce 40 to 50 gallons per day in winter?
Cold water is physically denser and more viscous than warm water, which makes it harder for the RO membrane to push water molecules through the polyamide film. The temperature correction factor at 50°F is approximately 0.625, meaning the membrane produces about 62.5 GPD at rated pressure before any pressure losses are applied. Add low line pressure and actual output can fall below 45 GPD on a 100 GPD membrane. This is expected physics, not membrane failure.
What is the brine-to-permeate ratio for a standard residential RO system?
Standard single-pass residential systems operate at roughly 20% recovery, producing four gallons of brine for every one gallon of filtered permeate. This ratio is determined by the system design, not the membrane condition or water quality. Permeate pump upgrades, bladder tanks, and recirculation configurations can push recovery to 30 to 50%, reducing the brine ratio to approximately 1:1 to 2.3:1 at the high end.
Will a booster pump fix cold water performance problems?
Partially. A booster pump addresses the pressure side of the correction formula, which is linear and straightforward. It does not change feed water temperature or the exponential TCF penalty. At 50°F, even with 80 PSI from a booster pump, the system is still operating at 77% of rated output due to temperature alone. For significant cold-water performance gaps, both thermal management and pressure optimization may be necessary together.
How often should I replace my RO membrane?
Most thin-film composite membranes have a service life of two to five years depending on feed water quality, pre-treatment adequacy, and operating pressure. Rather than replacing on a fixed schedule, track your corrected GPD over time using this calculator with consistent input values. A measurable decline in output that cannot be explained by temperature or pressure changes is the clearest indicator that membrane replacement is warranted.
Does water temperature affect brine volume?
Temperature affects how fast pure water is produced, but not the ratio of brine to permeate at a fixed recovery rate. At 20% recovery, four gallons of brine are rejected per gallon of permeate regardless of temperature. Cold water does cause the system to run longer to fill a storage tank, which means more total brine is rejected over a longer period, but the per-gallon ratio remains constant as long as recovery is fixed.
What is the difference between GPD recovery rate and membrane efficiency?
Recovery rate describes the proportion of feed water that becomes permeate (20% for standard systems). Membrane efficiency in this context refers to how close actual GPD is to rated GPD under real operating conditions, expressed as a percentage. A membrane running at 77°F and 65 PSI has 100% efficiency against its rating. The same membrane at 50°F and 45 PSI delivers about 43% efficiency, still at 20% recovery. These are related but independent metrics.
Conclusion
The rated GPD on an RO membrane is a standardized laboratory reference, not a field delivery promise. Temperature and pressure correction factors determine what the membrane actually produces, and in cold climates or low-pressure systems, those corrections can cut output nearly in half while brine continues flowing at full rate. The single most important thing this calculator provides is a concrete number to plan against, rather than a label value that applies only under conditions most real installations never see.
The mistake that costs growers the most, in replacement hardware, in elevated water bills, and in undersized storage, is skipping the correction step entirely and assuming the label rating is the production rate. Before purchasing a larger membrane, adding a storage tank, or adjusting an irrigation schedule around assumed water volume, run the actual numbers with your real temperature and pressure inputs. For installations that also require source water quality monitoring, pairing RO output planning with well shock chlorination scheduling ensures that pre-treatment is calibrated to the same feed conditions the membrane will face during operation.
Lead Data Architect
Umer Hayiat
Founder & Lead Data Architect at TheYieldGrid. I bridge the gap between complex agronomic data and practical growing, transforming verified agricultural science into accessible, mathematically precise tools and guides for serious growers.
View all tools & guides by Umer Hayiat →


