
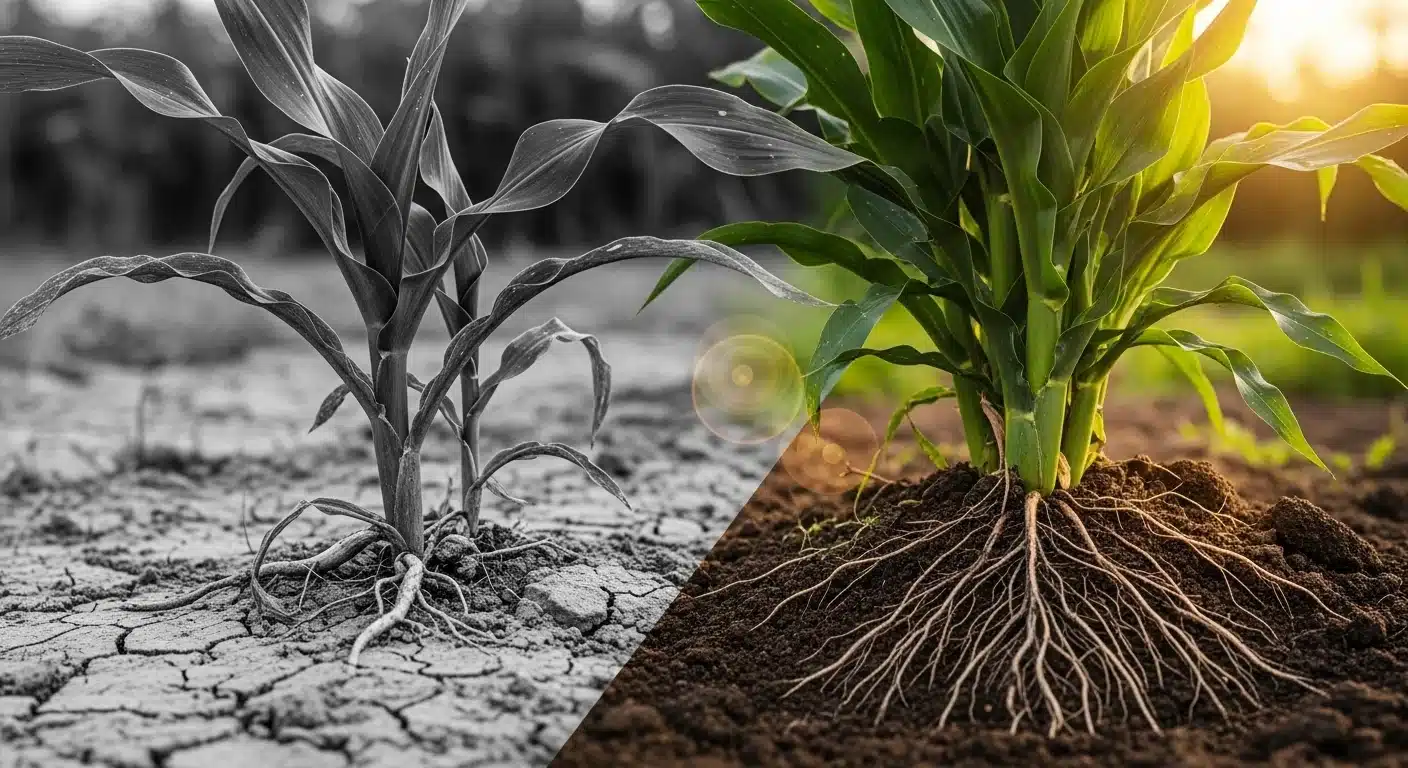
Phosphorus is one of the three primary macronutrients, yet it is also the most chemically reactive nutrient in the soil solution. Unlike nitrogen, which can move with water, phosphorus binds tightly to soil particles the moment it enters the wrong pH environment. A soil test showing “low P” does not automatically mean the soil needs more phosphorus fertilizer. In a significant number of cases, the soil already contains adequate total phosphorus, but the wrong pH has converted it into mineral compounds that plant roots cannot absorb.
This calculator estimates the fraction of measured soil phosphorus that is actually available to plant roots after accounting for two distinct fixation mechanisms: aluminum and iron binding (dominant in acid soils below pH 5.5) and calcium precipitation (dominant in alkaline soils above pH 7.5). It uses your soil test extraction method, measured phosphorus level, soil pH, and active Al/Fe concentration to produce an estimated available P figure in ppm. It does not predict crop yield, account for organic matter buffering, or replace a full agronomic recommendation from a certified soil scientist.
After running this tool, you will know whether the phosphorus deficiency visible in your crop is a supply problem (add more P) or a chemistry problem (fix the pH first). That single distinction determines whether your next fertilizer application is effective or wasted.
Use the Tool
| Soil pH Range | P Availability | Primary Mechanism | Status |
|---|---|---|---|
| < 4.5 | 5–10% | Extreme Al/Fe fixation | Critical |
| 4.5 – 5.5 | ~20% | High Al/Fe solubility + fixation | Very Low |
| 5.5 – 6.0 | ~55% | Moderate Al/Fe binding | Low |
| 6.0 – 7.0 | 85–100% | Optimal — minimal fixation | Optimal |
| 7.0 – 7.5 | ~60% | Ca/Mg precipitation begins | Moderate |
| 7.5 – 8.0 | ~40% | Ca-phosphate precipitation | Low |
| > 8.0 | < 20% | Strong Ca precipitation lock | Critical |
How this calculator works — Formula & Methodology
Overview
This calculator estimates the fraction of soil phosphorus (P) that is actually available to plant roots after accounting for pH-driven fixation by aluminum (Al), iron (Fe), and calcium (Ca).
Step 1 — Determine base availability from pH
If 5.5 ≤ pH < 6.0 → base availability = 55%
If 6.0 ≤ pH ≤ 7.0 → base availability = 100% (optimal zone)
If 7.0 < pH ≤ 7.5 → base availability = 60%
If pH > 7.5 → base availability = 40% (Ca precipitation)
Step 2 — Apply Al/Fe lockout penalty
Al/Fe threshold (Olsen): High = 100 ppm · Very High = 200 ppm
If pH < 5.5 AND Al/Fe > Very High → additional −30% (total fixation ≈ 80%)
If pH < 5.5 AND Al/Fe > High → additional −20%
If pH 5.5–6.0 AND Al/Fe > Very High → additional −15%
If pH 5.5–6.0 AND Al/Fe > High → additional −10%
Step 3 — Apply Ca precipitation penalty
If pH > 8.0 → additional further −20%
Step 4 — Compute available P
Available P (ppm) = Measured P (ppm) × (Availability Factor / 100)
Available P is rounded to one decimal place.
Method-specific notes
- Bray-1: Designed for acid soils (pH < 7). Underestimates P in alkaline soils. Thresholds apply with standard Al/Fe sensitivity.
- Mehlich-3: Universal extraction. Broadly applicable. Thresholds same as Bray-1 in this model.
- Olsen (NaHCO₃): Preferred for alkaline/calcareous soils. More sensitive to Al/Fe at lower concentrations. Thresholds halved vs. Bray-1.
Assumptions & Limits
- Al/Fe input should represent the higher of Al or Fe from your Mehlich-3 or KCl extraction.
- This model treats Al/Fe and Ca as independent mechanisms — real soils may exhibit compounding effects.
- Organic matter, clay mineralogy, and phosphorus buffering capacity are not accounted for — they can further reduce or increase availability by ±10–20%.
- Optimal zone is defined as pH 6.0–7.0 in the model. Many agronomists accept 5.8–7.2 for most crops.
- Results are educational estimates only — always cross-reference with a certified agronomist and a full soil nutrient report.
- This tool does not replace a laboratory-calibrated recommendation.
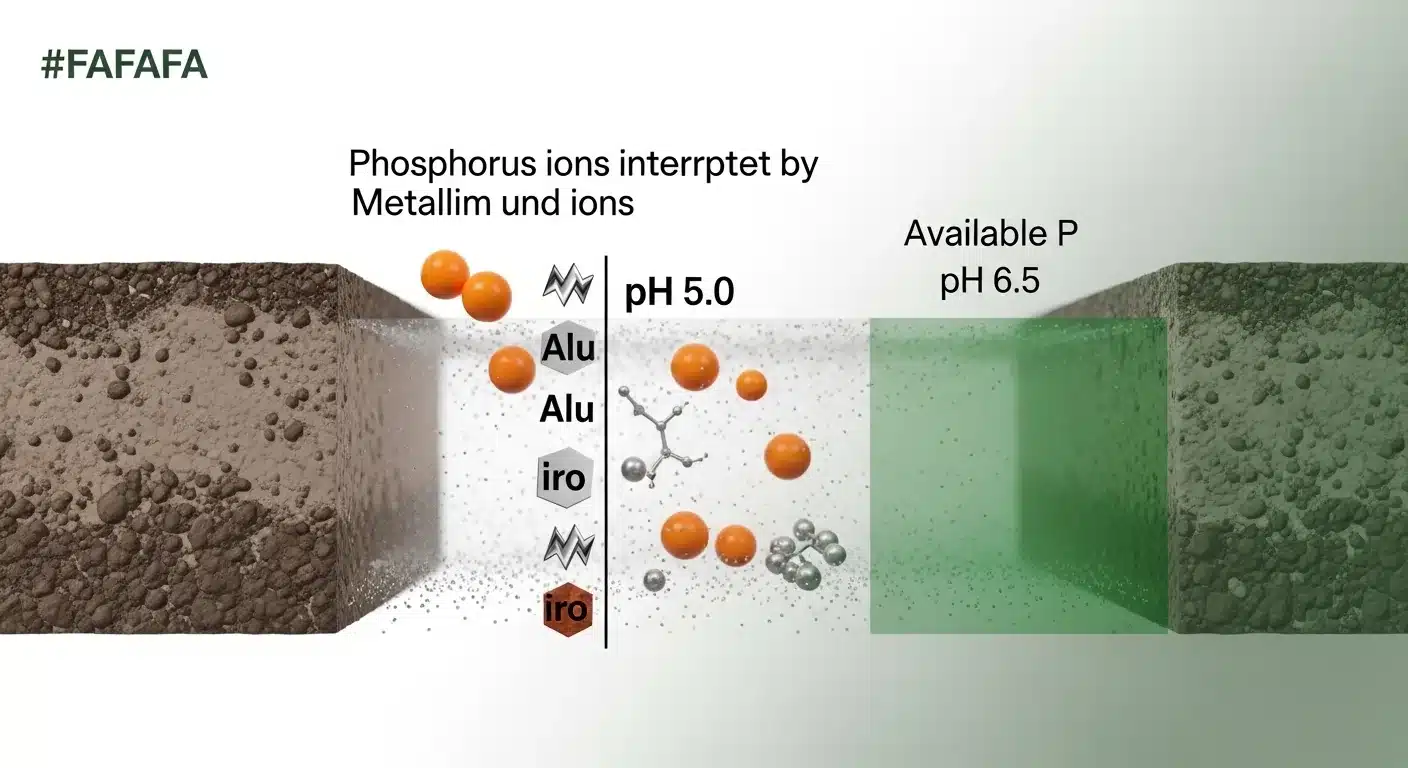
The Aluminum Handcuff — Why High P Fertilizer Often Fails
A grower sees low phosphorus on a soil test and applies 100 lbs of expensive Triple Super Phosphate (0-46-0) on pH 5.0 soil. The crop still shows severe purple P-deficiency. Why?
At pH 5.0, soil aluminum (Al) and iron (Fe) are highly soluble. The moment applied phosphate ions reach the soil, they react with dissolved Al³⁺ and Fe³⁺ to form aluminum phosphate (AlPO₄) — an insoluble mineral. The fertilizer is chemically locked within hours and is completely unavailable to plant roots.
The only remedy is to correct soil pH with calcitic or dolomitic lime before applying P fertilizer. Raising pH above 6.0 precipitates Al and Fe out of solution, removes the handcuff, and allows applied phosphorus to remain plant-available.
On the alkaline side (pH > 7.5), calcium (Ca) creates a similar trap: phosphate reacts with Ca²⁺ to form calcium phosphate minerals (hydroxyapatite, dicalcium phosphate) that are only sparingly soluble. Organic sources of P (e.g., bone meal) release phosphate slowly and are less susceptible to rapid precipitation.
Before entering values, have your most recent soil test report in hand. You will need the pH reading, the phosphorus level in ppm (not lbs/acre), the extraction method your lab used (Bray-1, Mehlich-3, or Olsen), and the aluminum or iron value from the same report. If your lab ran a Mehlich-3 panel, Al and Fe values are typically included. Use whichever is higher. If only one is reported, use that figure. For help understanding how cation exchange capacity interacts with aluminum saturation in acid soils, the CEC soil calculator covers that connection in detail.
Quick Start (60 Seconds)
- Soil pH: Enter the pH value directly from your lab report. Acceptable range is 3.0 to 10.0. Do not round to a whole number; use the decimal (e.g., 6.2, not 6).
- Phosphorus Level (ppm): Enter the number as reported on the soil test, in parts per million. If your report shows lbs/acre, divide by 2 to approximate ppm. Do not enter the sufficiency rating (Low/Medium/High); enter the numeric value.
- Test Method: Select the extraction method printed on your lab report header. Bray-1 is standard for acid soils, Olsen for alkaline or calcareous soils, and Mehlich-3 is a universal extraction used by most commercial labs. Selecting the wrong method shifts the Al/Fe thresholds and can overstate or understate the fixation penalty.
- Active Al/Fe (ppm): Enter the higher of the aluminum or iron value from your Mehlich-3, KCl, or 0.01M CaCl2 extraction panel. If both are reported, use whichever is greater. If neither is available, contact your lab and request a Mehlich-3 rerun that includes micronutrient fractions.
- Click Calculate: All four fields must be filled before the result panel activates. If a field is missing or out of range, an inline error will appear next to that field.
- Review the traffic lights: The three status indicators (Al/Fe Lockout, Ca Precipitation, and pH Zone) tell you which fixation mechanism is active. A red indicator means corrective action is needed before P fertilizer will work.
- Check the warnings box: The deterministic warnings panel converts your inputs into specific, actionable alerts, including whether the tool has flagged a method mismatch between your extraction type and your soil pH range.
Inputs and Outputs (What Each Field Means)
| Field | Unit | What it represents | Common mistake | Safe entry guidance |
|---|---|---|---|---|
| Soil pH | Unitless (log scale) | The active hydrogen ion concentration in the soil solution, which controls Al, Fe, and Ca solubility and therefore P availability | Using a meter reading taken in wet or freshly fertilized soil, which is temporarily depressed | Use a lab-measured pH from a sample taken at least 2 weeks after any lime or fertilizer application; enter one decimal place |
| Phosphorus Level (P) | ppm | Total extractable phosphorus detected by the chosen method, representing the pool the tool will discount by the fixation factor | Entering lbs/acre instead of ppm, which inflates the input by roughly 2x | Confirm the unit on the report header; if lbs/acre, divide by 2 before entering |
| Test Method | Categorical | The soil extraction chemistry used by the lab; each method has different sensitivity to Al and Fe, so mismatching inflates or deflates the Al/Fe thresholds applied in the model | Selecting Bray-1 for a calcareous soil because "that's what the lab always uses," when Olsen is the correct method for pH above 7.0 | Read the extraction method from the lab report header, not from memory; Bray-1 is invalid above pH 7.0 |
| Active Al/Fe (ppm) | ppm | The soluble or exchangeable aluminum and iron concentration that actively competes with phosphate ions for binding sites; the primary driver of P fixation in acid soils | Entering total Al from an aqua regia digestion (which is 10 to 50 times higher than plant-available Al); only use Mehlich-3, KCl, or 0.01M CaCl2 extracted values | If the report does not specify extraction method for Al/Fe, call the lab before entering the value |
| Available P (ppm) [output] | ppm | The estimated fraction of measured P that remains plant-accessible after both Al/Fe and Ca fixation penalties are applied | Treating this as the only metric; a high available P at pH 8.2 still represents heavy Ca-precipitation pressure and will decline further as the season progresses | Cross-reference against crop sufficiency thresholds: most annual crops need 15 to 30 ppm available P for adequate early season uptake |
| Availability Factor [output] | % of measured P | The combined efficiency multiplier applied to measured P; a factor of 20% means only one-fifth of applied fertilizer P will be available to roots under current conditions | Assuming factor is fixed through the growing season; P fixation intensifies as soils dry, which can drop availability further than the static model predicts | Use the factor as a planning tool for lime priority, not as a fertilizer rate multiplier for a single application |
| Traffic Light: Al/Fe Lockout [output] | Red / Orange / Green | Indicates whether active aluminum and iron concentrations at the current pH are high enough to cause significant phosphate binding | Ignoring a red indicator because the measured P level looks "high enough," when in fact the P pool is almost entirely fixed | A red Al/Fe indicator is a stop sign for P fertilizer; apply lime first |
| Traffic Light: Ca Precipitation [output] | Red / Orange / Green | Indicates whether calcium-phosphate precipitation is reducing P availability on the alkaline side of the pH scale | Attributing P deficiency in high-pH soils to micronutrient competition rather than Ca precipitation | A red Ca indicator calls for soil acidification with elemental sulfur, not additional P fertilizer |
| Traffic Light: pH Zone [output] | Red / Orange / Green | A direct classification of the current pH against the optimal zone (6.0 to 7.0) where P availability reaches its maximum | Assuming a green pH zone means all nutrients are available; some micronutrients behave differently near pH 7.0 | Use the pH zone indicator alongside base saturation data for a complete picture of soil chemistry |
Worked Examples (Real Numbers)
Scenario 1: Acid Corn Field with Severe Al/Fe Lockout
- Soil pH: 5.0
- Phosphorus (Bray-1): 30 ppm
- Active Al/Fe (Mehlich-3): 350 ppm
- Test method: Bray-1
Calculation: Base availability at pH 5.0 = 20%. Al/Fe at 350 ppm exceeds the Bray-1 High threshold (200 ppm) but falls below the Very High threshold (400 ppm), applying a 20% additional penalty. Calcium precipitation penalty = 0% (pH below 7.5). Availability factor = max(5%, 20% - 20% - 0%) = 5%. Available P = 30 x 0.05 = 1.5 ppm.
Result: 1.5 ppm available P (5% availability factor).
Despite a Bray-1 reading of 30 ppm, the combination of strongly acid pH and elevated aluminum has fixed nearly all of the soil phosphorus into aluminum phosphate. A 100 lb/acre Triple Super Phosphate application at this pH would deliver the same outcome. Lime is the first and only correct intervention.
Scenario 2: Optimally Buffered Garden Soil
- Soil pH: 6.5
- Phosphorus (Mehlich-3): 45 ppm
- Active Al/Fe (Mehlich-3): 150 ppm
- Test method: Mehlich-3
Calculation: Base availability at pH 6.5 = 100% (optimal zone). Al/Fe at 150 ppm is below the Mehlich-3 High threshold (200 ppm) and pH is not in the penalty range, so no Al/Fe adjustment applies. Ca penalty = 0% (pH below 7.5). Availability factor = 100%. Available P = 45 x 1.00 = 45.0 ppm.
Result: 45.0 ppm available P (100% availability factor).
This is the target condition. Every unit of soil phosphorus is accessible, and any applied P fertilizer will enter the plant-available pool rather than being fixed. Maintaining pH in this zone is the single most effective phosphorus management strategy available.
Scenario 3: Alkaline Irrigated Field with Ca Precipitation
- Soil pH: 8.2
- Phosphorus (Olsen): 20 ppm
- Active Al/Fe: 40 ppm
- Test method: Olsen
Calculation: Base availability at pH 8.2 = 18% (above 8.0 band). Al/Fe at 40 ppm is below the Olsen High threshold (100 ppm) and pH is above the fixation range (6.0+), so no Al/Fe penalty applies. Ca precipitation penalty at pH above 8.0 = 40%. Availability factor = max(5%, 18% - 0% - 40%) = max(5%, -22%) = 5%. Available P = 20 x 0.05 = 1.0 ppm.
Result: 1.0 ppm available P (5% availability factor).
Even though the Olsen P reading of 20 ppm appears borderline adequate, calcium is precipitating nearly all of it into hydroxyapatite and dicalcium phosphate. Adding more phosphate fertilizer accelerates precipitation rather than improving uptake. Acidification with elemental sulfur or banded application of liquid orthophosphate starters are the most practical interventions at this pH.
Reference Table (Fast Lookup)
The table below shows estimated available P for a baseline soil test reading of 30 ppm across a range of pH, Al/Fe, and method combinations. The Availability Factor and Available P columns are computed directly from the model formula.
| Soil pH | Al/Fe (ppm) | Method | Base Availability | Fixation Penalty | Availability Factor | Available P at 30 ppm Baseline | Interpretation |
|---|---|---|---|---|---|---|---|
| 4.8 | 450 | Bray-1 | 20% | Al/Fe -30% (Very High) | 5% (floored) | 1.5 ppm | Critical lockout; lime and retest before any P application |
| 5.0 | 250 | Bray-1 | 20% | Al/Fe -20% (High) | 5% (floored) | 1.5 ppm | Aluminum handcuff active; P fertilizer is largely wasted |
| 5.0 | 80 | Bray-1 | 20% | None (below High threshold) | 20% | 6.0 ppm | Low availability from pH alone; liming will recover 5x more P |
| 5.8 | 250 | Mehlich-3 | 55% | Al/Fe -10% (High, pH 5.5-6.0 band) | 45% | 13.5 ppm | Moderate; liming to 6.2+ would unlock an additional ~16 ppm at this P level |
| 6.5 | 150 | Mehlich-3 | 100% | None | 100% | 30.0 ppm | Optimal; full P pool accessible to roots |
| 7.2 | 50 | Olsen | 60% | None | 60% | 18.0 ppm | Moderate; Ca precipitation beginning; monitor pH drift |
| 7.8 | 60 | Olsen | 40% | Ca -20% (pH 7.5-8.0) | 20% | 6.0 ppm | Low; Ca-phosphate locking is significant; banded P starters improve uptake |
| 8.3 | 40 | Olsen | 18% | Ca -40% (pH above 8.0) | 5% (floored) | 1.5 ppm | Critical; soil acidification required; broadcast P is ineffective |
How the Calculation Works (Formula + Assumptions)
Show the calculation steps
Step 1: Base Availability from pH
The model assigns a base P availability percentage derived from documented soil chemistry relationships between pH and aluminum, iron, and calcium solubility:
- pH below 4.5: 8% base availability (extreme Al/Fe solubility)
- pH 4.5 to below 5.5: 20% base availability
- pH 5.5 to below 6.0: 55% base availability
- pH 6.0 to 7.0: 100% base availability (optimal zone)
- pH 7.0 to 7.5: 60% base availability
- pH 7.5 to 8.0: 40% base availability
- pH above 8.0: 18% base availability
Step 2: Al/Fe Fixation Penalty
Al/Fe thresholds differ by extraction method because each method extracts a different fraction of soil aluminum and iron:
- Bray-1 and Mehlich-3: High = 200 ppm, Very High = 400 ppm
- Olsen: High = 100 ppm, Very High = 200 ppm
Penalty applies only when pH is below 6.0 (the range where Al/Fe solubility is elevated):
- pH below 5.5, Al/Fe above Very High threshold: subtract 30%
- pH below 5.5, Al/Fe above High threshold: subtract 20%
- pH 5.5 to below 6.0, Al/Fe above Very High: subtract 15%
- pH 5.5 to below 6.0, Al/Fe above High: subtract 10%
Step 3: Ca Precipitation Penalty
- pH above 8.0: subtract 40%
- pH 7.5 to 8.0: subtract 20%
- pH at or below 7.5: no Ca penalty
Step 4: Final Calculation
Availability Factor = Base% - Al/Fe Penalty% - Ca Penalty%, floored at 5%.
Available P (ppm) = Measured P (ppm) x (Availability Factor / 100).
Available P is rounded to one decimal place.
Rounding and Units
All intermediate percentages are applied as decimal multipliers. The floor of 5% prevents the model from reaching zero, acknowledging that even severely fixed soils maintain a small fraction of desorbing P in the soil solution. No unit conversions are required; all P inputs and outputs remain in ppm.
Assumptions and Limits
- The Al/Fe input must represent extractable (plant-available fraction) aluminum or iron, not total elemental content from a complete digestion. Using total Al/Fe will overestimate fixation by a factor of 10 to 50.
- The model treats Al/Fe fixation and Ca precipitation as independent additive mechanisms. In soils near pH 6.0 to 7.0, both mechanisms may be partially active simultaneously, and the actual fixation may differ from the sum of individual penalties.
- Organic matter is not factored in. Organic matter increases the buffering capacity of the soil and can reduce P fixation by 10 to 20% in soils with more than 4% organic matter content.
- Clay mineralogy is not accounted for. High-activity clays (montmorillonite) fix more P per unit Al/Fe than low-activity kaolinitic clays, especially in highly weathered tropical soils.
- The model assumes a static snapshot in time. In irrigated or seasonally wet soils, redox conditions fluctuate, and iron cycling can cause P availability to shift dramatically between wet and dry periods.
- This tool does not calculate application rate recommendations or account for crop P uptake targets, removal rates, or residual P from prior applications.
- Soil temperature is not modeled. P diffusion to roots is significantly slower in cold soils (below 10 degrees Celsius), which compounds availability losses from fixation.
- Results are estimates for educational and prioritization purposes only. A certified crop adviser or certified professional agronomist should be consulted before making large-scale fertilization or amendment decisions.
Standards, Safety Checks, and "Secret Sauce" Warnings
Critical Warnings
- The Aluminum Handcuff: When soil pH is below 5.5 and active Al/Fe exceeds 200 ppm (Bray-1/Mehlich-3) or 100 ppm (Olsen), any water-soluble phosphate applied to the soil (including Triple Super Phosphate, MAP, or DAP) will react with dissolved Al3+ and Fe3+ within hours to form aluminum phosphate (AlPO4) and iron phosphate (FePO4), both insoluble at this pH. The chemical bond formed is covalent and effectively permanent under field conditions. Applying P fertilizer without first correcting pH is a guaranteed financial loss. The soil pH lime calculator can help you determine the lime rate needed to raise pH above 6.0 before any P fertilizer is applied.
- The Alkaline Precipitation Lock: Above pH 7.5, calcium-phosphate precipitation converts applied orthophosphate into hydroxyapatite and dicalcium phosphate, which are sparingly soluble and largely unavailable to annual crops. Increasing P application rates in this scenario accelerates precipitation without improving plant uptake. The correct sequence is soil acidification first (elemental sulfur, acidifying nitrogen sources), confirmed by retesting, then P application. For calculating how much sulfur is needed, the soil pH sulfur calculator provides method-specific dosing guidance.
- Method Mismatch Warning: Bray-1 is acid-based and dissolves at pH above 7.0, meaning it overextracts phosphorus in calcareous soils and produces falsely elevated readings. Using a Bray-1 value with an alkaline soil pH will cause this calculator to underestimate fixation because the apparent P level is artificially high. Only Olsen or Mehlich-3 values should be used for soils with pH above 7.0.
- Deficiency Misdiagnosis: Purple or reddish leaf coloration in young plants is the classic visible symptom of P deficiency. In most cases, the first grower response is to apply liquid P starter fertilizer. If the underlying cause is Al/Fe fixation at low pH, this intervention provides no sustained benefit. Tissue testing alongside soil testing is the only way to confirm that visual symptoms translate into actual plant P status shortfalls.
Minimum Standards
- Soil pH must be raised to and maintained within the 6.0 to 7.0 range before broadcast phosphorus fertilizer applications can be considered efficient for most agronomic crops.
- Al/Fe extractable levels should remain below the High threshold for the extraction method used (200 ppm for Bray-1/Mehlich-3; 100 ppm for Olsen) before P applications are expected to deliver ROI-positive results.
- Soil test phosphorus should be retested after any pH-correcting amendment has fully equilibrated (typically 3 to 6 months after lime incorporation) before concluding that additional P fertilizer is needed.
Competitor Trap: Most online phosphorus calculators and soil fertility guides present phosphorus sufficiency ranges without tying them to the extraction method used or the pH at which the test was run. A Bray-1 reading of 25 ppm in a pH 5.0 soil and a Mehlich-3 reading of 25 ppm in a pH 6.5 soil represent completely different agronomic situations, yet both would be rated "Low" by a generic sufficiency chart. The fixation mechanism is the missing variable, and without accounting for it, growers are flying blind on one of the most expensive line items in their input budget.
Common Mistakes and Fixes
Mistake: Applying More P Fertilizer When the Soil Test Shows Low P
The reflex response to a low soil phosphorus reading is to apply more phosphorus. In an acid soil below pH 5.5 or an alkaline soil above pH 7.5, additional P fertilizer does not enter the available pool; it joins the fixed fraction. The new fertilizer P simply displaces existing fixed P at equilibrium without increasing the plant-available concentration. Running an NPK balance plan using a tool like the NPK calculator is only meaningful once you confirm that the applied phosphorus can actually reach the soil solution.
Fix: Address soil pH first. Retest P availability after pH correction before adjusting fertilizer rates.
Mistake: Using Total Al or Fe from a Complete Digestion Report
Total elemental analysis (aqua regia or X-ray fluorescence digestion) reports aluminum and iron values that represent the geological parent material, not the plant-available exchangeable fraction. These values can be 10 to 50 times higher than Mehlich-3 extracted Al/Fe. Entering a total digestion Al value into this calculator will produce a severely exaggerated lockout penalty and an erroneously low available P estimate.
Fix: Only use Al and Fe values from Mehlich-3, KCl, or 0.01M CaCl2 extractions. The lab report header will specify the extraction method used.
Mistake: Selecting the Wrong Extraction Method
Bray-1 extraction chemistry breaks down in calcareous soils (pH above 7.0) because the acid extractant is neutralized before it can dissolve phosphorus from the soil matrix. This produces overestimated P readings in alkaline soils. Conversely, entering an Olsen P value for a strongly acid soil underestimates available P because Olsen was calibrated for calcareous conditions. The Al/Fe threshold values in this model are also method-specific, so a method mismatch shifts two parameters simultaneously.
Fix: Read the extraction method directly from the soil report header. If the report does not specify, call the lab. Do not assume.
Mistake: Ignoring Al/Fe Data Because It Is Not Labeled "Critical" by the Lab
Soil labs often provide Al and Fe values without sufficiency ratings, because the interpretation depends on the interaction with pH, something that generic lab software does not compute. A grower seeing "Al: 180 ppm" with no flagging might conclude it is within normal range. At pH 5.2, 180 ppm of Mehlich-3 Al represents a soil on the verge of the High fixation threshold (200 ppm), and a modest pH decline during the growing season can push it over. Soil texture also plays a role: high-clay soils have more surface area for Al/Fe binding, and confirming clay fraction using the soil texture calculator helps contextualize whether your Al/Fe reading represents elevated solubility or simply a high-surface-area mineral baseline.
Fix: Interpret Al and Fe values relative to both the extraction method threshold AND the current soil pH. Never treat them as standalone numbers.
Mistake: Treating the Availability Factor as a Fertilizer Rate Multiplier
Some users interpret a 20% availability factor as meaning they should apply 5x more P to compensate. This logic is flawed in two ways: first, the additional fertilizer faces the same fixation mechanism and largely joins the fixed pool; second, overapplication drives soil phosphorus saturation, increasing runoff risk and the potential for downstream water quality impacts. The availability factor is a diagnostic indicator, not a rate-adjustment coefficient.
Fix: Use the availability factor to prioritize pH correction, not to scale up fertilizer inputs. After pH correction, recalculate to determine whether P supply is actually insufficient.
Next Steps in Your Workflow
If this calculator has flagged an Al/Fe lockout or Ca precipitation condition, the immediate next step is calculating the lime or sulfur rate needed to shift soil pH into the 6.0 to 7.0 optimal window. Lime rates depend on your soil's buffering capacity (CEC and organic matter content) and the target pH shift required. The agricultural lime calculator covers these inputs and gives method-specific application rates for calcitic and dolomitic sources. Once a lime application schedule is established and soil pH is confirmed via retesting, return to this tool to re-evaluate your available P before scheduling any phosphorus fertilizer applications.
For growers managing soils with significant organic matter inputs (manure, compost, cover crops), organic nitrogen and phosphorus cycles interact with soil pH and Al/Fe dynamics in ways that a simple soil test snapshot may not capture. The manure nitrogen availability calculator helps quantify the organic contribution to your nutrient budget, which can offset the need for additional mineral P fertilizer in some rotation cycles, particularly after pH has been corrected and the native soil phosphorus pool is accessible again.
FAQ
What is the difference between Bray-1 and Olsen phosphorus tests?
Bray-1 uses a dilute acid extractant that dissolves aluminum- and iron-bound phosphorus efficiently in acid soils (pH below 7.0). Olsen uses sodium bicarbonate, which is calibrated for alkaline and calcareous soils where carbonate chemistry dominates. Using Bray-1 on a calcareous soil produces an inflated P reading because the extractant's acid is neutralized by the soil's buffering capacity before it fully reaches the phosphorus fraction.
Why does soil pH between 6.0 and 7.0 produce maximum phosphorus availability?
At pH values below 6.0, aluminum and iron become increasingly soluble and react immediately with phosphate ions. Above pH 7.0, calcium concentration in the soil solution increases and precipitates phosphate as calcium phosphate minerals. The 6.0 to 7.0 window is the narrow band where both mechanisms are suppressed simultaneously, allowing phosphate to remain in the soil solution long enough for root uptake.
Can I improve phosphorus availability without changing the soil pH?
To a limited degree. Banding phosphorus fertilizer in a concentrated narrow zone near the seed row reduces the soil volume exposed to fixation. Liquid orthophosphate starters deliver P in a form that can be taken up before soil fixation occurs. Mycorrhizal fungi extend root surface area to access fixed P pools. These are all valid short-term tactics, but they do not solve the underlying chemistry and become less effective as soil pH moves further from the optimal range.
How accurate is this calculator compared to a full lab-based P availability test?
This tool applies a modeled availability factor based on well-established soil chemistry relationships. It is accurate enough for prioritization decisions (is pH correction urgent before P fertilization?) but is not a substitute for calibrated crop-specific P sufficiency interpretations provided by your land-grant university or certified crop adviser. Error margins widen in soils with unusual clay mineralogy, very high organic matter, or atypical Al/Fe speciation.
What happens to phosphorus that has been fixed by aluminum or iron? Is it permanently lost?
Fixed phosphorus is not permanently lost, but its recovery depends on soil conditions. Raising pH with lime causes aluminum and iron to precipitate out of solution, releasing some previously fixed phosphate back into the plant-available pool. This is one of the most direct economic benefits of liming acid soils: it releases existing soil phosphorus without any additional P fertilizer input. The recovery is not immediate and typically occurs over 3 to 18 months after lime equilibration.
Why does the calculator show a minimum availability of 5%, even in the worst conditions?
The 5% floor reflects the reality that even severely fixed soils maintain a small dynamic equilibrium between fixed and soluble phosphate forms. Phosphorus continuously desorbs from fixation sites at slow rates, and the soil solution never reaches a true zero P concentration. The floor prevents the model from producing a result that implies complete unavailability, which would overstate the case and underestimate the value of root architecture and mycorrhizal uptake in stressed soils.
Conclusion
Soil phosphorus availability is not simply a question of how much phosphorus is in the soil. It is a question of what the soil's pH and active aluminum, iron, and calcium concentrations are doing to that phosphorus at any given moment. The most expensive and common mistake in phosphorus management is applying fertilizer to a soil whose chemistry has already guaranteed that the investment will be fixed, precipitated, and unavailable before the roots arrive. This calculator exists specifically to expose that gap before the fertilizer purchase is made.
The priority order from this analysis is clear: correct pH first, confirm via retesting, then evaluate whether additional phosphorus supply is actually needed. For growers managing boron or other micronutrients alongside phosphorus, it is worth noting that many micronutrient availability dynamics mirror phosphorus in their pH sensitivity, which the boron fertilizer calculator addresses for that specific element. The single most effective soil phosphorus management decision most growers can make is not on the fertilizer order form. It is on the lime application rate.
Lead Data Architect
Umer Hayiat
Founder & Lead Data Architect at TheYieldGrid. I bridge the gap between complex agronomic data and practical growing, transforming verified agricultural science into accessible, mathematically precise tools and guides for serious growers.
View all tools & guides by Umer Hayiat →


