
Dashboard speedometers on tractors do not measure how far the machine actually travels across a field. They measure the rotational speed of the transmission output shaft, then translate that number through a fixed formula that assumes the rear tires have perfect, zero-slip contact with hard pavement. Once you add a tilled seedbed, saturated clay, or sandy loam to the equation, that assumption breaks down completely. The tractor wheels spin faster than the tractor moves forward, and every mph the speedometer claims becomes a mathematical overstatement of actual ground coverage.
This tractor ground speed calculator uses two independent formulas to produce two separate speed numbers: a theoretical MPH derived from your engine RPM, gear ratio, and tire rolling circumference, and a true MPH derived from a stopwatch test over a measured 200-foot course in the actual field. It does not predict soil traction, tire wear rates, or optimal nozzle selection. Its singular output is the real forward speed your boom sprayer is traveling when the booms are open, expressed in miles per hour, ready to be used in any GPA calibration formula.
After running this calculator, you will have the one number that controls herbicide application accuracy. Use the True MPH result in your GPA calculation and discard the dashboard reading for any field with prepared or wet soil.
Use the Tool

Boom Sprayer Ground Speed Calculator
Tractor ground speed calculator — true MPH vs. theoretical gear speed
Your Gear Speed Reference Table
| Time (sec) | True MPH | vs Theoretical | Slip % | Spray Accuracy |
|---|---|---|---|---|
| Calculate to generate reference table | ||||
- GPS speedometer (bypasses all wheel slip errors — most accurate)
- TeeJet calibration pitcher & nozzle flow meter
- 100-ft fiberglass measuring tape for test strip marking
- Agricultural marking dye (confirm actual spray coverage)
How This Calculator Works — Formula & Assumptions
Step 1: Theoretical Speed (Gear Calculation)
Based on engine RPM, gear ratio, and tire size — assumes zero wheel slip (like driving on pavement).
The constant 1056 converts inches-per-minute to miles-per-hour (63,360 in/mi ÷ 60 min = 1056).
Step 2: True Field Speed (Track Test)
Measured by timing your tractor over a 200-foot course marked in the actual field. This is the only number that matters for herbicide GPA calculations.
0.6818 = 60 min/hr ÷ 88 ft/min per mph. Equivalently: (200 ÷ Time) × (3600 ÷ 5280).
Step 3: Wheel Slip Penalty
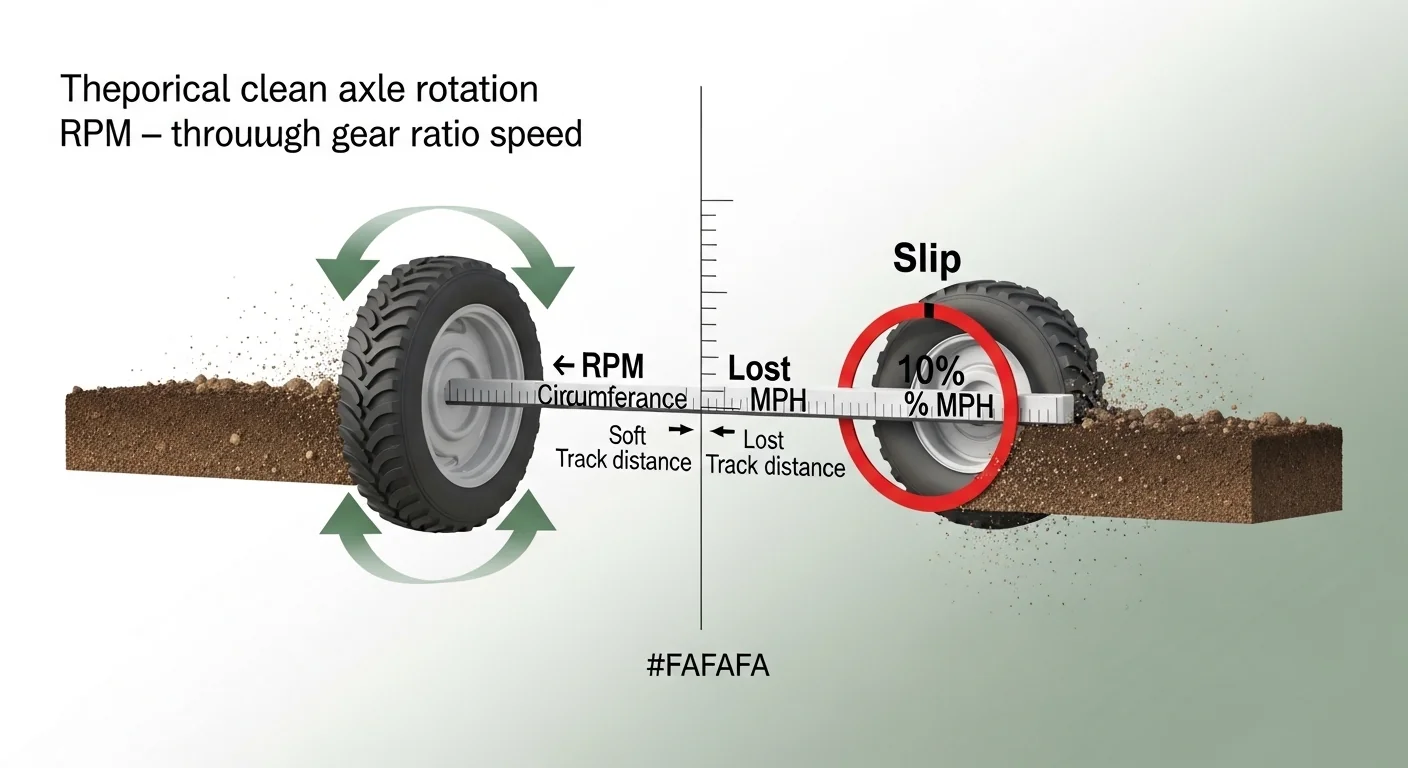
The “Speedometer Lie” — Why This Matters
Dashboard speedometers read internal gear speed (Theoretical MPH). In tilled, wet fields, wheel slip causes actual forward motion to be 20–35% slower. A farmer calibrating at 5 MPH (dashboard) may only be moving 3.8 MPH. Because Gallons Per Acre (GPA) is inversely proportional to speed, under-speed means over-application by 30%+ — causing chemical burn, crop loss, and regulatory violations.
Always use True MPH (track test result) for all herbicide GPA calculations.
Assumptions & Limits
- 200-foot test strip must be measured in the actual field being sprayed (not pavement)
- Gear ratio values are representative estimates; verify from your tractor operator’s manual
- Tire circumference should be measured under normal field load (not cold, not overinflated)
- Stopwatch accuracy matters: use a phone timer and average 2–3 runs
- Calculator does not account for terrain slope or draft load beyond slip
- Valid engine RPM range: 500–4000; circumference: 60–260 inches; time: 5–600 seconds
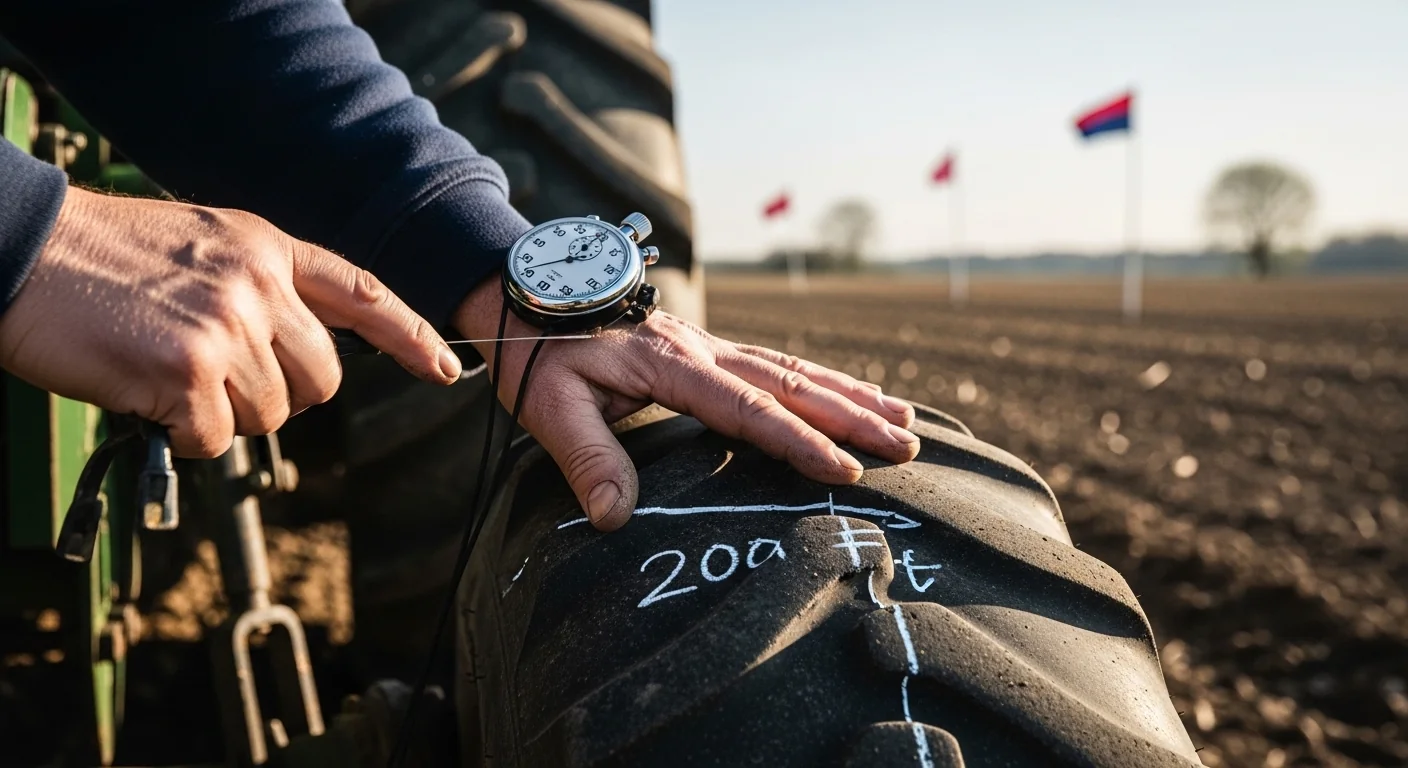
Before you begin, have three things in front of you: your tractor operator’s manual (or a gear ratio chart) for the gear you plan to spray in, a tape measure or field-measured 200-foot course already marked with flags, and a stopwatch. Measure the tire rolling circumference at field load, not off a cold tire sitting in the shed. If you have not run the 200-foot track test yet, complete it first at normal spraying speed before entering any numbers. For the related output side of this workflow, the boom sprayer calibration calculator converts your confirmed true speed into a verified gallons-per-acre figure.
Quick Start (60 Seconds)
- Engine RPM: Enter the rated RPM required to achieve 540 PTO speed, typically 1,700 to 2,400 RPM depending on the tractor model. Do not use idle RPM or full-throttle field RPM without verifying against the PTO spec in your manual.
- Gear Ratio: Select the gear you will actually spray in. If your tractor has a creeper or a split-range transmission, the presets may not match; use the custom field and enter the value from your operator’s manual.
- Tire Rolling Circumference: Mark the sidewall with chalk, roll exactly one full revolution on level ground, and measure the distance in inches. Do this under a representative load, ideally with the sprayer full. A typical 18.4 x 38 tire measures 142 to 148 inches depending on inflation pressure and load.
- 200-ft Track Time: Measure a 200-foot course inside the field using a fiberglass tape measure, not a paced estimate. Start the stopwatch when the front axle crosses the first flag and stop it at the second. Average two or three runs.
- Do not mix soil types: If the field has wet corners and firm hilltops, run separate track tests for each condition.
- Click Calculate only after filling all four fields. The widget performs inline validation; any empty or out-of-range field blocks the result.
Inputs and Outputs (What Each Field Means)
| Field | Unit | What It Measures | Common Mistake | Safe Entry Range |
|---|---|---|---|---|
| Engine RPM | RPM | Crankshaft speed at which the PTO operates at its rated 540 RPM output. This is the mechanical input that drives the entire theoretical speed calculation. | Entering full-throttle field RPM instead of the rated PTO engagement RPM from the spec plate or manual. | 500 to 4,000 RPM. Most field applications fall between 1,700 and 2,400 RPM. |
| Gear Ratio | Dimensionless | The ratio of axle revolutions per engine revolution through the selected transmission gear. Smaller numbers mean slower ground speed at a given RPM. | Selecting a gear ratio for a different range (e.g., high range vs. low range) than what is actually being used in the field. | 0.005 to 0.500. Typical spraying gears fall between 0.018 and 0.042. |
| Tire Rolling Circumference | Inches | The actual ground contact distance the rear tire covers in one complete rotation under field load. This differs from the static circumference calculated from the tire sidewall dimensions alone. | Using the tire diameter listed on the sidewall to calculate circumference (pi times diameter) instead of rolling the tire and measuring the actual travel distance. | 60 to 260 inches. Common ag tires measure 132 to 165 inches. See also: the PTO shaft sizing calculator if PTO drive length is affected by tire or hitching changes. |
| Track Time (200 ft) | Seconds | Elapsed time for the front axle to cover a 200-foot measured course at normal spraying speed inside the field being treated. | Running the test on the gravel headland or a compacted lane rather than in the representative field soil conditions. | 5 to 600 seconds. A typical 4 to 6 MPH spraying pass covers 200 feet in 23 to 34 seconds. |
| True MPH (output) | MPH | Actual forward travel speed derived from the 200-foot track test. This is the only speed that should be used in GPA spray calculations. | Averaging a wet-field run with a dry-field run and using the average for all calibration math. | Result only. No input required. |
| Theoretical MPH (output) | MPH | Speed predicted by the transmission gear ratio, engine RPM, and tire circumference assuming zero wheel slip. Matches dashboard speed under ideal, firm pavement conditions. | Using this number for spray calibration in field conditions. | Result only. |
| Slip Penalty (output) | MPH | The gap between theoretical and true speed. Represents the speed the tractor “loses” to wheel spin rather than forward travel. Directly converts to proportional chemical over-application above target GPA. | Assuming small slip values (under 1 MPH) are negligible; even 0.5 MPH of slip at low speeds represents a meaningful application error. | Result only. Values above 1.5 MPH warrant attention; values above 2 MPH indicate a critical calibration risk. |
| Wheel Slip Rate (output) | Percent | Slip penalty expressed as a fraction of theoretical speed. The traffic-light gauge shows green below 5 percent, amber at 5 to 15 percent, and red above 15 percent. | Reading the gauge color without checking the actual percent value; amber at 14 percent and amber at 6 percent carry very different calibration consequences. | Result only. Below 5 percent is acceptable for most herbicide applications. |
Worked Examples (Real Numbers)
Example 1: Dry Corn Ground, Minimal Wheel Slip
- Engine RPM: 2,200
- Gear: 1st Low (ratio 0.0182)
- Tire Rolling Circumference: 142 inches
- Track Time: 27 seconds
Result: Theoretical MPH = (2,200 x 0.0182 x 142) / 1,056 = 5.38 mph. True MPH = (200 x 0.6818) / 27 = 5.05 mph. Slip = 0.33 mph, Slip Rate = 6.1 percent (warning zone).
Even on firm ground, a 6.1 percent slip rate means the sprayer is traveling about a tenth of a mile per hour slower than the transmission suggests. At a target of 15 gallons per acre, actual application rises to roughly 16 gallons per acre if the dashboard speed is used instead of the measured 5.05 mph.
Example 2: Freshly Tilled, Moist Seedbed
- Engine RPM: 2,200
- Gear: 1st Low (ratio 0.0182)
- Tire Rolling Circumference: 142 inches
- Track Time: 36 seconds
Result: Theoretical MPH = 5.38 mph. True MPH = (200 x 0.6818) / 36 = 3.79 mph. Slip = 1.59 mph, Slip Rate = 29.6 percent (critical).
A 9-second difference in track time from Example 1 produces a speed gap of 1.26 mph and a slip rate that exceeds the critical threshold by nearly double. A farmer targeting 15 GPA with the speedometer reading would actually deliver approximately 21 gallons per acre, a result that can produce visible herbicide burn on sensitive crops within days of application.
Example 3: Larger Utility Tractor, 1st High Gear
- Engine RPM: 1,900
- Gear: 1st High (ratio 0.0241)
- Tire Rolling Circumference: 155 inches
- Track Time: 31 seconds
Result: Theoretical MPH = (1,900 x 0.0241 x 155) / 1,056 = 6.71 mph. True MPH = (200 x 0.6818) / 31 = 4.40 mph. Slip = 2.31 mph, Slip Rate = 34.4 percent (critical).
Larger rear tires increase theoretical speed substantially, but field conditions do not change with tire size. Higher theoretical speed amplifies the absolute value of any given slip percentage, making GPA errors larger in absolute terms even at the same percent slip rate as a smaller tractor.
Reference Table (Fast Lookup)
The table below uses a fixed setup of 2,200 RPM, 1st Low gear (ratio 0.0182), and 142-inch tire circumference, producing a theoretical speed of 5.38 mph. The “Actual GPA at 15 gal Target” column is computed as 15 x (5.38 / True MPH) and shows what the sprayer delivers if calibrated using dashboard speed rather than the measured true speed.
| Track Time (sec) | True MPH | Slip MPH | Slip Rate (%) | Status | Actual GPA at 15 gal Target |
|---|---|---|---|---|---|
| 24 | 5.68 | 0.00 | 0.0 | Pass (tractor outpaces gear calc; check tire data) | 14.2 |
| 26 | 5.25 | 0.13 | 2.4 | Pass | 15.4 |
| 28 | 4.87 | 0.51 | 9.5 | Warning | 16.6 |
| 30 | 4.55 | 0.83 | 15.4 | High Slip | 17.7 |
| 33 | 4.13 | 1.25 | 23.2 | Critical | 19.5 |
| 36 | 3.79 | 1.59 | 29.6 | Critical | 21.3 |
| 40 | 3.41 | 1.97 | 36.6 | Critical | 23.7 |
| 46 | 2.96 | 2.42 | 45.0 | Critical | 27.2 |
| 55 | 2.48 | 2.90 | 53.9 | Critical | 32.5 |
The GPA column illustrates a non-linear relationship: as the tractor slows due to slip, each additional second of track time adds a greater absolute volume of chemical per acre than the one before it. Spraying at 55-second track speed while calibrated for 28-second conditions results in more than double the intended application volume.
How the Calculation Works (Formula and Assumptions)
Show the Calculation Steps
Step 1: Theoretical MPH
The formula converts rotational engine speed through the gear ratio and tire circumference into a linear ground speed:
Theoretical MPH = (Engine RPM x Gear Ratio x Tire Circumference in inches) / 1,056
The constant 1,056 is derived from unit conversion: there are 63,360 inches in one mile, and 60 minutes in one hour, so 63,360 / 60 = 1,056 inches per minute per mph. This formula assumes the tire does not slip; every axle rotation translates to exactly one tire circumference of forward travel.
Step 2: True MPH
The stopwatch test removes the no-slip assumption by measuring actual forward displacement:
True MPH = (200 x 0.6818) / Track Time in seconds
The factor 0.6818 converts feet per second to miles per hour (1 mph = 1.4667 ft/sec; 1 / 1.4667 = 0.6818). Equivalently, this is the same as multiplying feet per second by 3,600 seconds per hour, then dividing by 5,280 feet per mile.
Step 3: Slip Penalty and Slip Rate
Slip Penalty (mph) = Theoretical MPH minus True MPH
Slip Rate (percent) = (Slip Penalty / Theoretical MPH) x 100
A negative slip penalty (true faster than theoretical) indicates a data entry error, most commonly a wrong gear ratio or a tire circumference measured on the wrong size tire.
Rounding Rules
All speed outputs are rounded to two decimal places. The slip rate percentage is rounded to one decimal place. These rounding levels are sufficient for spray calibration purposes; field variability across a 200-foot course exceeds rounding error at all practical spraying speeds.
Assumptions and Limits
- The 200-foot test course must be run inside the field being sprayed, on soil representative of actual spraying conditions. Headland, lane, or gravel results are not valid substitutes.
- Gear ratio presets in the dropdown are representative values for common row-crop tractors. Actual ratios vary by make, model, transmission variant, and optional range packages. Always verify against your operator’s manual.
- Tire rolling circumference must be measured under representative field load with the sprayer at working fill level, not empty.
- The formula does not account for terrain slope. Running the 200-foot course on a slope introduces grade error; always run on representative, approximately level ground.
- Track time should be the average of at least two measured runs. Single-run timing introduces stopwatch-reaction error of 0.2 to 0.5 seconds, which at 30-second runs represents a meaningful speed error.
- The tool does not account for tire flex or soil compaction changes over the course of a long application day. In soft conditions, slip rates increase as soil consolidates under repeated passes.
- Valid input ranges: RPM 500 to 4,000; circumference 60 to 260 inches; track time 5 to 600 seconds. Inputs outside these ranges are rejected by the calculator.
Standards, Safety Checks, and Secret Sauce Warnings
Critical Warnings
- The Speedometer Lie is active any time soil is tilled or wet. Tractor dashboards read theoretical transmission output speed, assuming full, pavement-grade tire traction. In a disced field with adequate moisture for good germination, the conditions that benefit a crop are the same ones that produce meaningful wheel slip. The dashboard can legitimately overstate true ground speed, and because GPA scales inversely with speed, that overstatement directly becomes chemical over-application.
- GPA error is proportional to the speed error. The math is direct: if your true speed is 80 percent of your theoretical speed, you will apply 25 percent more product per acre than intended. There is no rounding that softens this. A label rate of 15 GPA becomes roughly 19 GPA delivered, and the herbicide label’s rate range may not accommodate that margin. Exceeding label rate is a federal violation under FIFRA regardless of whether visible crop damage occurs.
- Consecutive field passes compound the error. A sprayer calibrated once on firm ground at the start of the season and never rechecked will produce increasing over-application error as field conditions change across the growing season, across fields, and across soil types.
- Tire inflation pressure shifts rolling circumference. A 2 PSI change in a large rear tire alters rolling circumference by approximately 1 to 2 inches. That change propagates directly into the theoretical speed calculation. If tires are inflated seasonally for road transport and then not readjusted for field work, the circumference input is incorrect before the first pass begins.
Minimum Standards
- Re-run the 200-foot track test at the start of every new field if soil type, tillage depth, or moisture conditions differ meaningfully from the previous location.
- Use the track-test True MPH exclusively for GPA calculations. Do not interpolate, round up, or substitute dashboard readings for convenience.
- Verify tire circumference at the beginning of each spraying season and after any tire change, pressure adjustment, or liquid ballast addition. Related: the tractor tire ballast calculator quantifies how ballast weight affects traction, and by extension, wheel slip behavior in soft soils.
- Record the measured True MPH for each field in your application records alongside the product rate, nozzle size, and boom pressure. This documentation supports label compliance and provides a baseline for future applications on the same field.
The Competitor Trap
Most tractor ground speed calculators online produce only the theoretical gear speed: RPM times ratio times circumference divided by a constant. They label that result “your ground speed” and stop there. That single-formula output is accurate on concrete and meaningless in a tilled field. The physical track test is the only method that captures what the tractor is actually doing in the actual soil. Any calculator that skips the track test step is giving you a number that applies to a surface you are not spraying on. Run the math. Run the test. Compare both. The gap between them is the number that determines whether your crop survives the application.
If drawbar power is a constraint that forces you into a heavier gear or higher RPM to maintain application speed, the drawbar horsepower calculator can help identify whether the tractor is working within its rated traction range, which indirectly affects how much slip you should expect at a given soil resistance.
Common Mistakes and Fixes
Mistake: Running the Track Test on the Headland Instead of the Field
The compacted soil near field edges, gates, and turn rows has substantially more bearing capacity than the tilled field body. A track test on the headland produces a faster true speed and lower slip reading than will occur during actual application. The error can easily be 1 to 2 mph depending on tillage depth and moisture.
Fix: Mark the 200-foot course at least two boom widths inside the field boundary, in soil that has received the same tillage and moisture as the area being sprayed.
Mistake: Using the Static Tire Diameter to Calculate Circumference
Tire sidewalls list the nominal section width and rim diameter, from which many farmers calculate circumference as pi times the estimated outer diameter. This method ignores tire deflection under load, which shortens the effective rolling radius compared to the free-rolling, unloaded geometry. The error typically ranges from 2 to 8 inches of circumference depending on tire size and load.
Fix: Mark one point on the tire, roll the tractor exactly one revolution on level ground under working load, and measure the distance between the two contact points. For further reading on how tire dimensions interact with tractor weight distribution, the 3-point lift capacity calculator touches on the rear axle load conditions that affect tire deflection.
Mistake: Timing a Single Track Pass with a Phone Reaction Delay
A single stopwatch run introduces human reaction time error at both the start and stop points. At a track time of 30 seconds, a combined 0.5-second reaction error translates to roughly a 3 to 5 percent speed calculation error, which pushes the result meaningfully across the Pass/Warning threshold.
Fix: Run three separate passes and average the times. Use a phone timer started by the co-operator standing at the far flag rather than the tractor operator reacting to wheel position.
Mistake: Using One Speed Measurement Across Multiple Field Conditions
A farm with rolling topography, varying clay content, and multiple tillage systems can have substantially different actual slip rates from field to field even when the transmission gear and RPM settings never change. Applying a slip rate measured in a firm, sandy-loam field to a spring-worked, heavy clay field introduces systematic error into every load mixed for the heavier ground. The cultivator sweep overlap calculator is an example of how tillage geometry varies per field; speed calibration requires the same field-specific approach.
Fix: Treat each distinct field, tillage condition, and soil zone as a separate calibration event. The track test takes under five minutes and is the cheapest crop insurance available.
Mistake: Entering the Gear Ratio for the Wrong Transmission Range
Many modern tractors use a two-range or three-range transmission where a given gear number exists in both a low and high range, producing very different ratios. Selecting “2nd Gear” from memory without specifying the range can produce a theoretical speed that differs from the actual by a factor of two or more, making the comparison between theoretical and true speed useless as a slip diagnostic.
Fix: Locate the transmission output shaft speed chart in your operator’s manual, identify the exact gear and range you spray in by its ratio number, and enter that value into the custom ratio field if the dropdown preset does not match.
Next Steps in Your Workflow
Once you have a confirmed True MPH from the track test, the immediate next task is to verify that your spray nozzles are delivering the correct flow rate at that speed. Nozzle output in gallons per minute, combined with boom width and ground speed, determines actual GPA delivered. The formula is straightforward: GPA = (nozzle GPM x 5,940) / (boom width in inches x speed in MPH). Many operators complete this step using the boom sprayer calibration calculator, which takes the confirmed speed as a direct input and outputs the expected application rate along with nozzle-specific checks.
Beyond spraying, the habit of running physical field calibration tests before each application extends naturally to other implements. If you are transitioning from pre-plant spraying into seeding operations, the seed drill calibration calculator applies a similar principle: field-verified speed determines seed spacing accuracy in the same way it determines spray output accuracy. The underlying message is identical across implement types. What the dashboard reads and what the machine delivers in a real field are two different things, and the gap between them is where crop losses happen.
FAQ
Why does my tractor speedometer read higher than my measured true speed?
The tractor speedometer reads the transmission output shaft speed and assumes no wheel slip. In tilled or soft soil, the rear tires spin faster than the tractor moves forward. The dashboard continues displaying the shaft speed (theoretical), while your actual forward progress falls short of that prediction. The gap is wheel slip, and it increases with softer soil, heavier draft loads, and lower tire inflation.
What gear should I spray in to minimize wheel slip?
Lower gear ratios at higher RPM generally produce more torque at the ground contact point, which can reduce slip compared to higher gears at lugged RPM. However, the only reliable way to know your slip rate in any gear is to run the 200-foot track test in that gear in the actual field. Choosing a gear without measuring gives you a theoretical answer to a field question.
How often should I re-run the 200-foot track test?
At minimum, once per field if soil conditions differ significantly from your last test location. In practice, if you are spraying multiple fields in a single day on similar soil types and similar tillage conditions, one morning test can serve that group of fields. After rain, after irrigation, or after switching tillage practices, run a new test before mixing product.
Can I use a GPS speed display instead of the track test?
A quality GPS speedometer reading actual satellite-derived position changes is the most accurate and convenient method for measuring true ground speed. It eliminates the stopwatch, the 200-foot tape, and timing error entirely. If you have a GPS speed display mounted in the cab, use that number for calibration and skip the track test. The wheel slip rate the calculator computes then becomes useful primarily as a mechanical diagnostic rather than a spray calibration input.
Does wheel slip affect my PTO-driven sprayer pump output?
No. PTO-driven pump output is determined by shaft RPM, which is driven by engine speed, not ground speed. Ground speed only affects how much area the sprayer covers per unit of time, and therefore how much product is deposited per acre. PTO pump flow rate is independent of wheel slip; GPA delivery is not.
What is a safe wheel slip rate for herbicide application?
Below 5 percent wheel slip, the theoretical and true speeds are close enough that using either for calibration produces acceptable results for most herbicide applications. Between 5 and 10 percent, using the measured True MPH is recommended. Above 10 percent, using the dashboard reading for calibration creates a meaningful GPA error. Above 15 percent, reconsider field conditions, tire inflation, or ballasting before application.
Conclusion
The tractor ground speed calculator resolves a specific mechanical deception built into every standard tractor dashboard: the reading assumes perfect traction that does not exist in agricultural soil. By computing both the theoretical gear speed and the track-test true speed simultaneously, the tool forces a direct comparison between the machine’s internal claim and the field’s physical reality. That comparison is what prevents a target GPA of 15 from becoming a delivered GPA of 22 on the most sensitive application day of the season.
The single most important behavior change this tool supports is simple: run the 200-foot track test before mixing product, not after a problem appears. Calibration after crop damage is documentation, not prevention. For those who also manage soil preparation and cultivating passes where ground speed and implement overlap interact, the flail mower RPM calculator extends the same verified-speed discipline into rotary implement calibration. Across every implement type, confirmed field speed is the number that connects equipment settings to agronomic outcomes.
Lead Data Architect
Umer Hayiat
Founder & Lead Data Architect at TheYieldGrid. I bridge the gap between complex agronomic data and practical growing, transforming verified agricultural science into accessible, mathematically precise tools and guides for serious growers.
View all tools & guides by Umer Hayiat →


