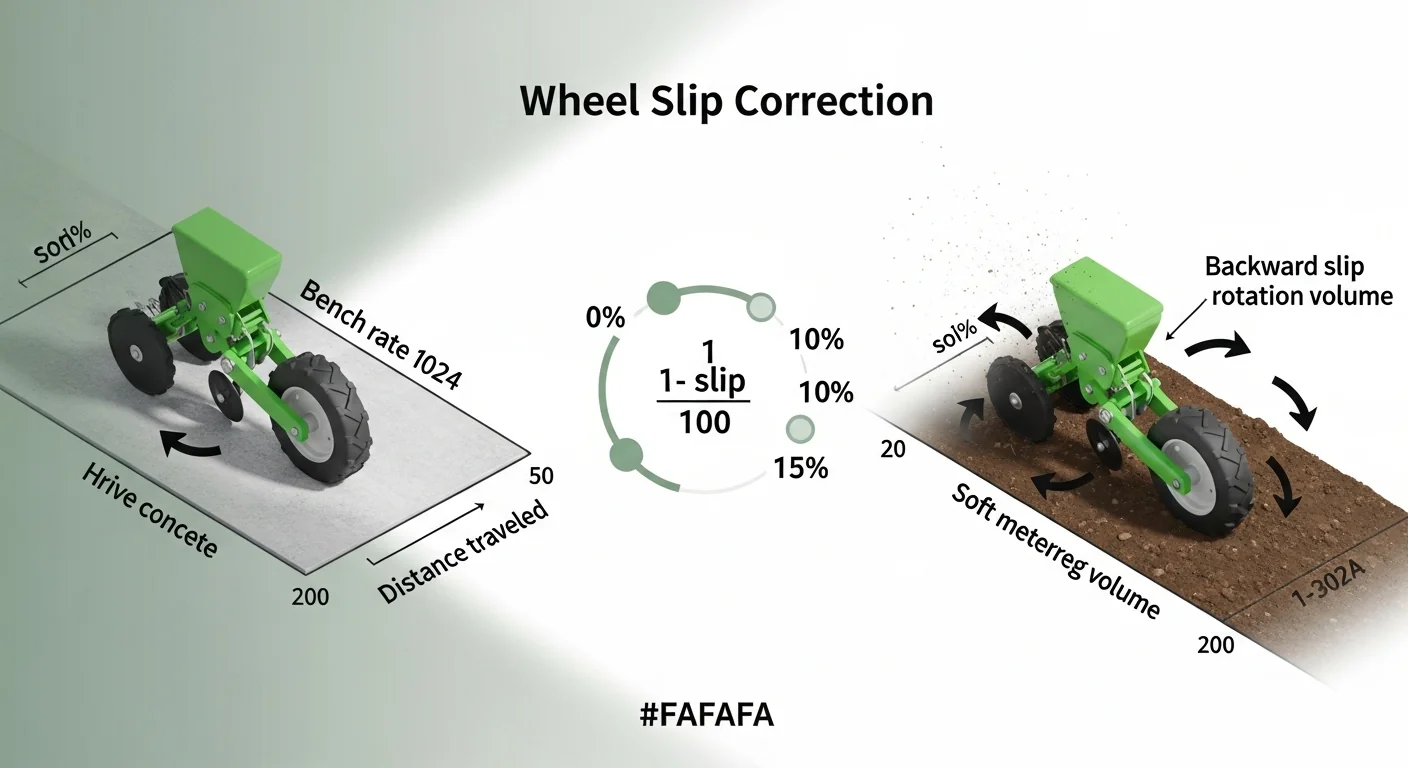
Every ground-driven seed drill calibration done on a hard surface produces a number that is technically correct for concrete and mechanically wrong for soil. The flute gate setting that delivers exactly 90 lbs per acre on a barn floor will deliver more in a tilled field, because the steel drive wheel that spins effortlessly on concrete loses traction on cultivated ground. That traction loss, called wheel slip, causes the wheel to rotate more times per unit of distance than the bench test assumed. More rotations per foot of travel means more seed dropped per foot of travel, without any change to your gate setting.
This calculator solves both sides of that problem. It converts your catch pan test output into a field-corrected application rate by applying a wheel slip factor matched to your soil condition. It does not predict emergence, it does not account for seed viability or row unit variation, and it cannot replace agronomic judgment about target populations. What it does is take the physics of agricultural traction seriously and give you the actual rate you are likely to plant, not the rate your bench test implied. Similar calibration logic applies to other field operations: the same kind of field-versus-bench correction is used when calibrating a boom sprayer where nozzle output measured at idle does not equal output at field speed.
After running this calculator, you will know whether to adjust your flute gate before entering the field, and by how much direction the error runs.
Use the Tool
| Seed Type | Typical Rate (lbs/Ac) | Expected g / 1,000 sq ft | Calibration Note |
|---|---|---|---|
| Winter Wheat | 90–120 | 93.6–124.8 | Bench-test before field use |
| Spring Wheat | 80–110 | 83.2–114.4 | Check for kernel size variation |
| Alfalfa | 12–18 | 12.5–18.7 | Very fine seed — use precision scale |
| Clover | 8–12 | 8.3–12.5 | Mix with carrier for accuracy |
| Barley | 80–100 | 83.2–104.0 | High-bulk seed, gate opens wide |
| Oats | 60–80 | 62.4–83.2 | Verify with multiple test runs |
| Corn | 20–35 | 20.8–36.4 | Precision planter — use count method |
| Soybeans | 60–90 | 62.4–93.6 | Confirm seed size with dealer |
How This Calculator Works
Step 1 — Area per Wheel Revolution
How much ground area does one wheel revolution cover?
Step 2 — Revolutions to Cover 1,000 sq ft
Normalizes the catch pan test to a standard area.
Step 3 — Expected Grams at Target Rate
Converts lbs/Acre to grams per 1,000 sq ft (1 Acre = 43,560 sq ft; 1 lb = 453.6 g).
Derivation: 453.6 g/lb ÷ 43,560 sq ft × 1,000 sq ft ≈ 10.41
Step 4 — Scale Catch Pan Output to 1,000 sq ft
Normalizes your actual catch pan weight to the same 1,000 sq ft baseline.
Step 5 — Bench Rate (no wheel slip)
What rate would you achieve on hard concrete with zero traction loss?
Step 6 — Wheel Slip Correction (The Critical Field Factor)
On soft, tilled soil the drive wheel slips — it spins more revolutions per foot of travel than on hard ground. This means it drops more seed per foot than you calibrated for on concrete.
Example: 10% slip → Field Rate = Bench Rate ÷ 0.90 (you plant ~11% more seed in the field than your bench test predicted.)
Assumptions & Limits
- Wheel slip percentage is an estimate — measure with GPS or distance wheel for precision.
- All row units are assumed to deliver equally; test multiple units if possible.
- Seed flow is assumed to be uniform and not bridging in the hopper.
- Temperature and seed moisture can shift 1,000-seed weight — re-calibrate each season.
- Formula is valid for ground-driven drills only. Air seeder fans are not modeled here.
- Results are ±5% of true field rate under typical conditions.
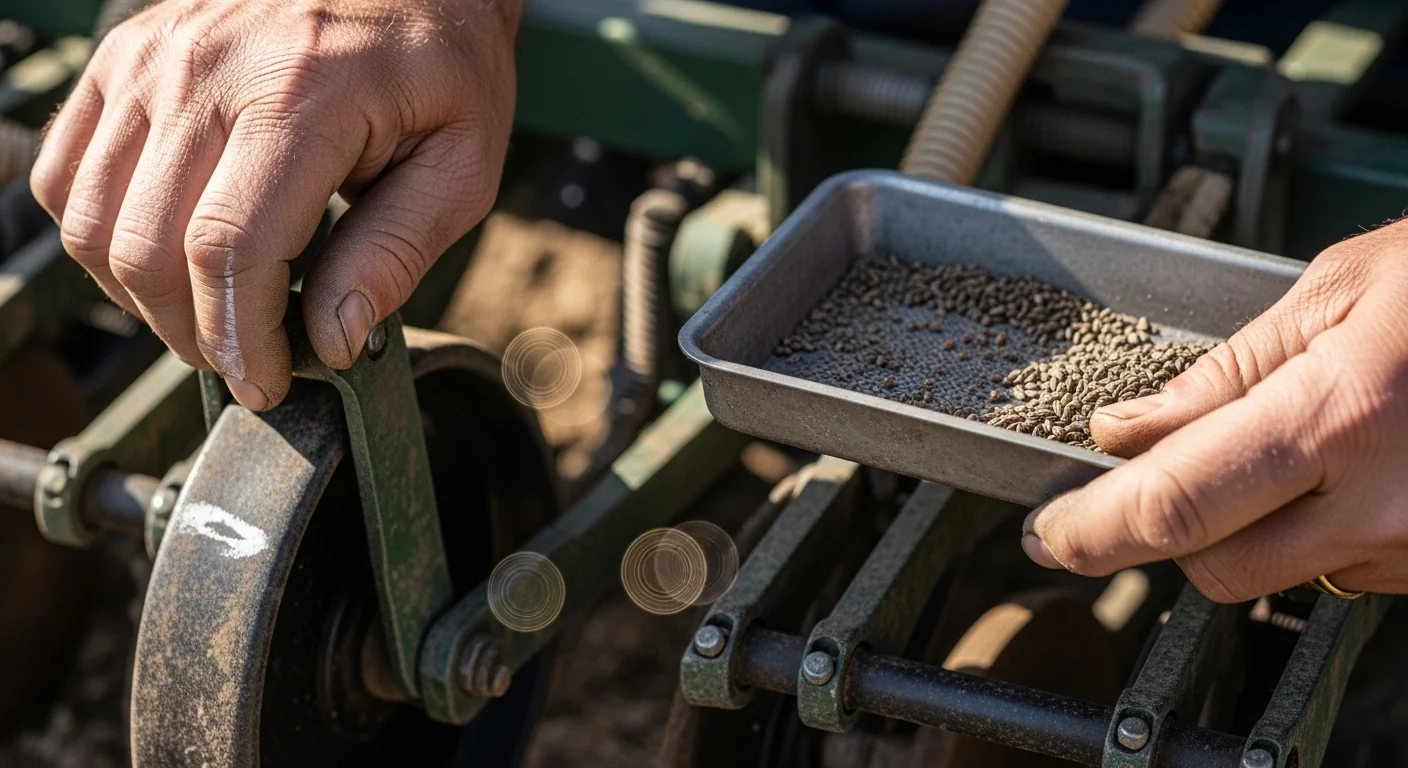
Before you start, have the following ready: your seed drill’s measured wheel circumference (a tape measure around the outer tire or press wheel, recorded in feet), the drill’s working width in feet, and a completed catch pan test with the gram weight of seed collected and the exact number of wheel revolutions you turned during the test. A precision digital gram scale accurate to 0.1 g is essential for alfalfa, clover, and other small-seeded crops where even a 5-gram error shifts the calculated rate significantly. Select your soil condition from the wheel slip chips before running the calculation.
Quick Start (60 Seconds)
- Seed Type: Select the crop from the dropdown. This highlights the correct row in the reference table so you can verify your rate falls within the typical range for that species.
- Target Application Rate (lbs/Acre): Enter the rate from your seed bag label or agronomist recommendation. Do not guess; errors here shift every output.
- Drill Width (ft): Use the actual working width of all openers combined, not the frame width. A 15-foot drill with end transport wheels folded still plants 15 feet.
- Drive Wheel Circumference (ft): Measure around the outside of the ground-drive wheel, not the diameter. A wheel that is 18 inches in diameter has a circumference of about 4.71 feet. Measure to the nearest 0.01 ft for accuracy.
- Wheel Revolutions (test): Count how many full revolutions you turned the drive wheel by hand during your catch pan test. More revolutions improves statistical accuracy; a minimum of 20 is recommended for small seeds.
- Catch Pan Output (grams): Weigh all seed collected from all row units together on a gram scale. Combining all units gives an average across the drill width; if you suspect individual unit variation, run row units separately and average the result.
- Wheel Slip: If you calibrated on a hard floor, choose “Tilled Field (typical)” at minimum before calculating the field rate. The default of 10 percent reflects typical conditions on a prepared seedbed. Adjust to match your actual field conditions.
Inputs and Outputs (What Each Field Means)
| Field | Unit | What It Represents | Common Mistake | Safe Entry Guidance |
|---|---|---|---|---|
| Seed Type | Select | Identifies the crop for table highlighting and context | Leaving it blank; the table reference will not highlight correctly | Choose the closest match; use “Other” if unlisted |
| Target Rate | lbs/Acre | The agronomic seeding rate you want to achieve in the field | Using seeds per acre instead of lbs per acre | Confirm with seed tag or agronomist; range 0.1 to 500 |
| Drill Width | feet | Total working width of all seeding row units combined | Using frame width rather than working width | Count the row units and multiply by spacing; range 1 to 120 ft |
| Wheel Circumference | feet | Outer circumference of the drive wheel that spins the metering shaft | Measuring diameter and forgetting to multiply by pi | Wrap a tape around the wheel; range 0.5 to 30 ft |
| Test Revolutions | count | Number of full wheel revolutions you turned during the catch pan test | Estimating instead of counting; half-turns throw off the math | Use a chalk mark on the wheel and count each full rotation; min 20 |
| Catch Pan Grams | grams | Total weight of seed collected from all row units during the test | Weighing only a subset of row units and scaling up mentally | Collect all row units together; weigh on a gram scale accurate to 0.1 g |
| Wheel Slip | percent | Estimated traction loss of the drive wheel on your field surface | Leaving at 0 after a barn-floor calibration and going straight to field | Use the soil condition chips; typical tilled field is 10 percent |
| Field Rate (output) | lbs/Acre | Estimated actual seeding rate in the field after wheel slip correction | Confusing this with bench rate and skipping the correction | This is the number to compare against your target rate |
| Bench Rate (output) | lbs/Acre | The rate your drill delivers on a hard surface with no traction loss | Using bench rate as the field rate; it will always understate field output | Use this to compare against expected grams; adjust gate if off by more than 10 percent |
| Wheel Slip Seed Waste (output) | percent | Extra seed applied in the field compared to your bench test, caused by traction loss | Treating this as a small rounding error; at 15 percent slip it can exceed cost tolerance | If this exceeds your agronomic threshold, reduce slip with tire ballast or lower ground speed |
Worked Examples (Real Numbers)
Example 1: Winter Wheat on a Prepared Seedbed, Calibration Passes
- Target rate: 120 lbs/Acre
- Drill width: 15 ft
- Wheel circumference: 4.7 ft
- Test revolutions: 20
- Catch pan output: 1,584 g
- Wheel slip: 10 percent (tilled field)
Area per revolution: 15 x 4.7 = 70.5 sq ft. Revolutions per 1,000 sq ft: 1,000 / 70.5 = 14.18. Scale factor: 14.18 / 20 = 0.709. Actual grams at 1,000 sq ft: 1,584 x 0.709 = 1,123 g. Bench rate: 1,123 / 10.4 = 108.0 lbs/Acre. Field rate with 10 percent slip: 108.0 / 0.90 = 120.0 lbs/Acre.
Result: 120.0 lbs/Acre field-corrected rate, 100 percent of target.
The calibration is accurate. The catch pan test gate setting is correct for a tilled-field condition with 10 percent wheel slip and does not require adjustment before planting.
Example 2: Alfalfa Under-Seeding Detected Before Field Entry
- Target rate: 15 lbs/Acre
- Drill width: 10 ft
- Wheel circumference: 3.5 ft
- Test revolutions: 40
- Catch pan output: 140 g
- Wheel slip: 5 percent (firm sod)
Area per revolution: 10 x 3.5 = 35 sq ft. Revolutions per 1,000 sq ft: 28.57. Scale factor: 28.57 / 40 = 0.714. Actual grams at 1,000 sq ft: 140 x 0.714 = 100.0 g. Bench rate: 100.0 / 10.4 = 9.6 lbs/Acre. Field rate with 5 percent slip: 9.6 / 0.95 = 10.1 lbs/Acre.
Result: 10.1 lbs/Acre field-corrected rate, 67 percent of target.
The flute gate is set too restrictively. The drill will plant roughly one-third less alfalfa than intended. The gate must be opened and the catch pan test repeated until the scaled gram output approaches 156 g per 1,000 sq ft (15 x 10.4).
Example 3: The Concrete Calibration Trap (Secret Sauce Scenario)
- Target rate: 100 lbs/Acre (Spring Wheat)
- Drill width: 15 ft
- Wheel circumference: 4.7 ft
- Test revolutions: 20
- Catch pan output: 1,467 g (calibrated to exactly 100 lbs/Acre on concrete)
- Wheel slip entered: 0 percent (barn floor)
Bench rate calculates to exactly 100.0 lbs/Acre. Field rate with 0 percent slip entered: 100.0 / 1.00 = 100.0 lbs/Acre. Now re-run with the actual field condition of 10 percent slip: field rate = 100.0 / 0.90 = 111.1 lbs/Acre.
Result: A 0-percent slip entry shows 100 lbs/Acre. The same gate, planted in a tilled field, actually delivers 111.1 lbs/Acre.
This is the wheel slip bankruptcy scenario. The calibration was not wrong; the slip input was. Eleven extra pounds of seed per acre across 100 acres is over 500 lbs of seed planted above target, with no yield benefit and real input cost.
Reference Table (Fast Lookup)
The table below shows the bench rate you must achieve on a hard surface to hit a given field target rate after wheel slip correction. The “Grams / 1,000 sq ft” column is the catch pan target to aim for during the bench test (before slip correction). Bench rates are computed as: Target Rate x (1 – Slip / 100).
| Target Field Rate (lbs/Ac) | Grams / 1,000 sq ft (target) | Required Bench Rate at 5% Slip | Required Bench Rate at 10% Slip | Required Bench Rate at 15% Slip | Typical Crop Range |
|---|---|---|---|---|---|
| 10 | 104 | 9.5 lbs/Ac | 9.0 lbs/Ac | 8.5 lbs/Ac | Clover, small cover crops |
| 15 | 156 | 14.3 lbs/Ac | 13.5 lbs/Ac | 12.8 lbs/Ac | Alfalfa |
| 40 | 416 | 38.0 lbs/Ac | 36.0 lbs/Ac | 34.0 lbs/Ac | Rye, cover crop blends |
| 60 | 624 | 57.0 lbs/Ac | 54.0 lbs/Ac | 51.0 lbs/Ac | Oats, soybeans (light) |
| 80 | 832 | 76.0 lbs/Ac | 72.0 lbs/Ac | 68.0 lbs/Ac | Soybeans, light wheat |
| 100 | 1,040 | 95.0 lbs/Ac | 90.0 lbs/Ac | 85.0 lbs/Ac | Spring wheat, triticale |
| 120 | 1,248 | 114.0 lbs/Ac | 108.0 lbs/Ac | 102.0 lbs/Ac | Winter wheat |
| 150 | 1,560 | 142.5 lbs/Ac | 135.0 lbs/Ac | 127.5 lbs/Ac | Heavy wheat, barley |
| 200 | 2,080 | 190.0 lbs/Ac | 180.0 lbs/Ac | 170.0 lbs/Ac | Heavy cover crop mixes |
Bench rates are computed from the formula: Required Bench Rate = Target Field Rate x (1 – Slip Fraction). Grams per 1,000 sq ft = Target Rate x 10.4.
How the Calculation Works (Formula + Assumptions)

Show the calculation steps
Step 1: Area covered per wheel revolution
Area per Revolution (sq ft) = Drill Width (ft) x Wheel Circumference (ft)
This tells you how much soil surface the drill passes over for each full rotation of the drive wheel.
Step 2: Revolutions needed to cover 1,000 sq ft
Revolutions per 1,000 sq ft = 1,000 / Area per Revolution
One acre is 43,560 sq ft. The 1,000 sq ft baseline is a standard intermediate unit that makes catch pan math tractable without moving large numbers.
Step 3: Expected grams at target rate
Expected Grams = Target Rate (lbs/Acre) x 10.4
Derivation: 1 lb = 453.6 g. One acre = 43,560 sq ft. So grams per 1,000 sq ft = 453.6 / 43,560 x 1,000 = 10.41, rounded to 10.4 for practical use.
Step 4: Scale catch pan output to 1,000 sq ft baseline
Actual Grams (1,000 sq ft) = Catch Pan Grams x (Revolutions per 1,000 sq ft / Test Revolutions)
This adjusts for however many revolutions you actually turned during the test.
Step 5: Bench rate (no slip)
Bench Rate (lbs/Acre) = Actual Grams (1,000 sq ft) / 10.4
This is the rate the drill delivers on a frictionless hard surface.
Step 6: Field rate with wheel slip correction
Field Rate (lbs/Acre) = Bench Rate / (1 – Slip Percent / 100)
Dividing by the non-slip fraction inflates the rate to account for extra revolutions the wheel makes per unit of actual ground covered. At 10 percent slip, the divisor is 0.90 and the field rate is 11.1 percent higher than bench rate.
Rounding rule: All intermediate values are carried to full decimal precision. Displayed results are rounded to one decimal place. Do not round intermediate steps when checking by hand.
Unit conversion summary: lbs to grams: x 453.592. Grams to lbs: / 453.592. Acres to sq ft: x 43,560. The constant 10.4 combines both conversions into one multiplier for the 1,000 sq ft baseline.
Assumptions and Limits
- Wheel slip percentage is estimated from soil type. GPS-based distance measurement or a dedicated slip meter will give a measured value more accurate than a lookup estimate.
- All row units are assumed to deliver the same output. If blockages, worn flute inserts, or variable seed size cause unit-to-unit variation, this calculator cannot detect it. Test multiple units individually if variability is suspected.
- Seed flow is assumed to be continuous and non-bridging during the catch pan test. A full hopper behaves differently than a hopper at less than one-quarter capacity in some flute gate designs.
- The 10.4 gram-per-lbs-per-1,000-sq-ft conversion assumes standard pound and acre definitions. It does not adjust for metric tons per hectare; convert inputs first if working in metric units.
- This formula is valid for ground-driven metering systems only. Fan-blown or hydraulic-metered air seeders use different calibration procedures not captured here.
- Temperature and seed moisture content can shift 1,000-seed weight between seasons. Calibrate against current-season seed, not last year’s records.
- Results carry an inherent tolerance of approximately plus or minus 5 percent under typical field conditions, based on the combined uncertainty of wheel circumference measurement, catch pan weighing precision, and slip estimation accuracy.
Standards, Safety Checks, and “Secret Sauce” Warnings
Critical Warnings
- The barn floor calibration error: A catch pan test performed on a concrete surface produces a bench rate with zero wheel slip. When that gate setting is used in a tilled field, the drive wheel slips, completing more rotations per acre than the bench test assumed, and delivers proportionally more seed. A 10 percent slip rate produces an 11.1 percent over-application relative to bench rate. Across a 200-acre planting, that error compounds into a measurable seed cost and potential stand density problem. Always re-enter a realistic slip value before treating your bench result as a field rate.
- Catch pan gram variance beyond 15 percent: If your scaled catch pan output differs from the expected grams figure by more than 15 percent in either direction, the calculator will flag it. Do not adjust the flute gate based on a single test that falls outside this band. Check for hopper bridging, worn metering components, seed size inconsistency, and that all row units collected seed before repeating the test.
- High slip conditions above 15 percent: On wet or very loose soil, wheel slip can exceed 15 percent. At that point the slip correction amplifies the bench rate substantially, and the error band on the slip estimate itself becomes agronomically significant. Consider reducing ground speed, adding front-axle ballast to improve traction, or deferring planting until soil conditions firm. The tractor tire ballast calculator can help you determine whether additional ballast would meaningfully reduce slip on a given tractor and tire combination.
- Ground speed consistency during field operation: Wheel slip varies with tractor ground speed. A calibration done at one travel speed is only accurate if that speed is maintained in the field. Faster speeds increase slip on soft ground. Slower speeds in wet soil can reduce it. Confirm your planned field speed against your calibration speed. The tractor ground speed calculator makes it straightforward to verify actual versus intended travel speed from tire size and transmission data.
Minimum Standards
- Catch pan test gram output should be within plus or minus 10 percent of expected grams before adjusting the flute gate for field use. Results outside this band indicate a measurement or equipment problem that should be diagnosed before making gate changes.
- Use a gram scale with a resolution of 0.1 g minimum. Kitchen scales accurate to 1 g or 5 g are insufficient for small-seeded crops like alfalfa or clover where the entire expected gram output may be under 200 g for a short test run.
- Conduct the catch pan test with the drill level and stationary in the same condition it will be used in the field (seed hopper at normal operating fill level, graphite or lubricant applied if used in field conditions).
Competitor Trap: Most online seed drill calibration guides stop at the bench rate calculation. They show you how to convert catch pan grams to lbs per acre and call that your calibration result. None of them account for the fact that a ground-driven drill planted in a tilled field is delivering seed at a higher rate than that bench number predicts, because the drive wheel is slipping. Following a bench-only calibration guide and planting 100 or more acres on that result is exactly the scenario that produces stands 10 to 15 percent thinner than intended, without any apparent error in the math.
Common Mistakes and Fixes
Mistake: Measuring Wheel Diameter Instead of Circumference
Circumference equals pi times diameter, approximately 3.14159 times the diameter. A wheel that is 18 inches (1.5 feet) in diameter has a circumference of 4.71 feet, not 1.5 feet. Entering the diameter directly understates the circumference by a factor of pi, which overstates the number of revolutions per 1,000 sq ft and inflates the bench rate dramatically. The error is easy to make and produces a wildly optimistic calibration result.
Fix: Wrap a flexible tape measure around the outside of the drive wheel and record the reading in feet, to the nearest 0.01 ft.
Mistake: Collecting Seed from Only Half the Row Units
If a drill has 16 row units and you collect seed from 8, then multiply by 2, you are assuming uniform output across all units. Worn opener boots, partially blocked seed tubes, and variable flute gate alignment all create unit-to-unit differences that this approach conceals. The result is a catch pan total that represents a smoothed average of the measured units, not the actual range of outputs the drill produces across its full width. Precision row spacing on competing crops, like the patterns optimized for cultivator sweep overlap, depends on consistent seed placement across the full working width.
Fix: Collect from all row units simultaneously in a single catch pan placed under the full drill, or collect each unit individually and compare for outliers.
Mistake: Running the Catch Pan Test with an Almost-Empty Hopper
Many flute gate designs are sensitive to seed head pressure from above. A full hopper applies downward pressure on the seed column above the metering flute, which can slightly increase output per revolution compared to a nearly empty hopper at the same gate setting. Calibrating with 10 lbs of seed remaining in a 300 lb hopper introduces a condition that will not exist for 95 percent of the planting day.
Fix: Conduct the catch pan test with the hopper at normal operating fill level, which is typically one-half to three-quarters full.
Mistake: Treating Wheel Slip as a Fixed Constant Across an Entire Field
Wheel slip is not uniform. Wet low spots in a field create more slip than drier knolls. Headland soil disturbed by turning creates more slip than mid-field. Using a single slip value for the entire field is a practical approximation, and it is the correct approach for a pre-plant calibration, but it means the edges and wet areas of the field will see a higher effective seeding rate than the table values predict. This is not a fault of the calculator; it is a physical limitation of ground-driven metering on variable terrain.
Fix: Select the slip value that represents the majority of your field’s condition, and note that low spots and headlands will trend toward over-application.
Mistake: Skipping Recalibration After Switching Seed Lots
1,000-seed weight varies between seed lots of the same variety, and between varieties, and between seed processors who clean and size differently. A gate setting calibrated to Lot A may deliver a different mass per revolution when switched to Lot B, even if both lots are labeled the same seeding rate. Seed that has been dried more aggressively is lighter; seed with higher moisture content is heavier per unit volume. The same flute opening does not guarantee the same weight throughput across different lots.
Fix: Run a fresh catch pan test and recalculate whenever the seed lot, variety, or seed source changes. The calculation takes less than five minutes and protects the entire planting operation. Soil moisture at the time of seeding also affects germination conditions; a properly calibrated boom sprayer used for pre-plant herbicide application similarly depends on re-calibration when product batches or nozzle wear change output.
Next Steps in Your Workflow
Once the calculator confirms your gate setting is within 10 percent of target at the slip value you selected, the next action is to record the gate notch position, slip chip chosen, and field rate number before starting. Do not rely on memory across a multi-day planting operation. If you change fields with meaningfully different soil conditions, return to the calculator with an updated slip value and verify whether the same gate setting still delivers an acceptable field rate, or whether it drifts outside tolerance.
After planting, verify emergence against your target population at two to three weeks. If stands are consistently thinner than expected across the whole field rather than in isolated wet spots, the most probable cause is higher-than-estimated wheel slip or a catch pan test that underrepresented one or more row units. Before that season’s data is forgotten, note the actual slip conditions and refine your input for next year. Planning the rest of your field operations in sequence is easier with a complete picture of draft and horsepower demands: the drawbar horsepower calculator helps verify your tractor is appropriately matched to the drill and soil resistance conditions, while the disc harrow weight per blade tool is useful when optimizing seedbed preparation passes that directly affect the surface condition your drive wheel will encounter.
FAQ
What is wheel slip on a seed drill and why does it matter?
Wheel slip is the difference between the distance a wheel rotates through (its circumference per revolution) and the actual ground distance it covers due to traction loss. On soft soil, a wheel slips backward relative to the ground, completing more revolutions per foot of forward travel than on hard surfaces. For a ground-driven drill, more revolutions per foot means more seed metered per foot, inflating the actual seeding rate above the bench test value.
How do I measure my drive wheel circumference accurately?
Wrap a flexible tape measure around the outside of the drive wheel, following the tread surface. Record the value in feet to the nearest hundredth of a foot. Do not measure the diameter and calculate circumference from it unless you can confirm your pi multiplication is precise. For a smooth steel press wheel, the measurement is straightforward. For a pneumatic tire, measure with normal inflation pressure and the drill in field-ready configuration.
How many wheel revolutions should I use for the catch pan test?
A minimum of 20 revolutions is generally recommended for medium to large seeds like wheat and soybeans. For very small seeds like alfalfa and clover, 30 to 40 revolutions improves the statistical reliability of the gram weight measurement. More revolutions reduces the proportional impact of a small weighing error on the final calculated rate. The calculator accepts any count from 1 to 500 revolutions.
What wheel slip percentage should I use for typical farm fields?
A tilled, prepared seedbed with normal soil moisture typically produces 8 to 12 percent wheel slip for a steel press wheel on a grain drill. The calculator defaults to 10 percent as a practical midpoint. Firm sod or packed ground runs 4 to 6 percent. Loose, sandy, or wet soil can push 15 to 20 percent. If you have GPS distance data or a dedicated slip meter, use the measured value directly via the custom slip input.
Why is my catch pan output different from the expected grams figure?
Several factors cause variance: the gate setting may not match your target rate and needs adjustment; seed lot size differs from the size used to establish the typical rate range; worn metering components deliver inconsistently; or the hopper fill level during the test differed from typical operation. If the variance exceeds 15 percent, the calculator will flag a warning. Diagnose the source before adjusting the gate, because closing the gate on an already-low output makes the problem worse.
Can I use this calculator for an air seeder with a fan-blown distribution system?
Not directly. Air seeders with ground-driven metering wheels can use the wheel slip correction logic, but fan-blown systems where seed is entrained in an air stream have additional variables including fan speed, tube length, and air velocity that affect distribution uniformity and are not captured in this calculator’s formula. The catch pan test approach is still valid for the metering component, but the slip correction applies only to the drive wheel, not the air distribution accuracy.
Conclusion
The seed drill calibration calculator on this page does one thing that most standalone calibration guides do not: it forces you to account for the gap between the rate your drill delivers on a hard bench and the rate it delivers in a real field. That gap is not a calibration error; it is a physics outcome of running a ground-driven machine on a surface that yields under load. Ignoring it means planting an unknown number of extra pounds per acre across every field, season after season, without the data to understand why stands run thin or why seed costs run high.
The single most avoidable mistake in seed drill calibration is treating a barn-floor bench rate as a field rate. Correct it before you leave the driveway by selecting the appropriate slip condition in the calculator and confirming the field-corrected number is within 10 percent of your agronomic target. After you confirm the seeding operation is dialed in, the rest of your equipment lineup deserves the same systematic approach: the subsoiler horsepower requirements tool is a useful next step if deep tillage precedes your planting operation and you want to verify tractor capacity before committing to a full field pass.
Lead Data Architect
Umer Hayiat
Founder & Lead Data Architect at TheYieldGrid. I bridge the gap between complex agronomic data and practical growing, transforming verified agricultural science into accessible, mathematically precise tools and guides for serious growers.
View all tools & guides by Umer Hayiat →


