
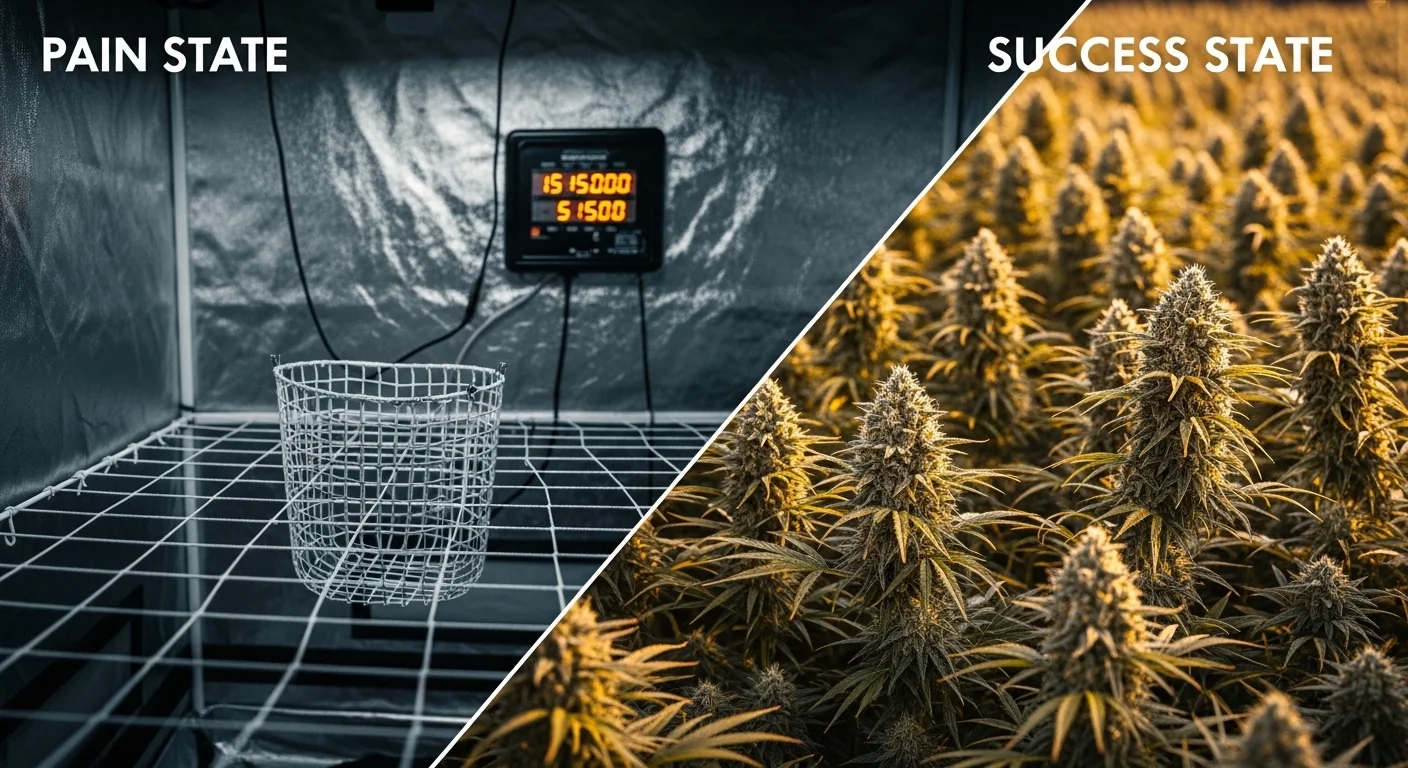
Plant count is not the bottleneck in indoor growing. Canopy coverage is. A single plant spread across a 4×4 screen and sixteen plants squeezed into the same footprint can produce identical yields on paper, but the time, electricity, and operational complexity to get there are radically different. The variable that most online guides skip is the vegetative electricity load: the wattage your lights burn for weeks before a single flower develops.
This tool calculates four connected outputs from your tent dimensions, grow style, yield target, and light wattage: total canopy area, estimated harvest weight in grams and ounces, grams per watt efficiency, and the electricity cost of your chosen vegetative period. It does not account for genetics, environmental variables, nutrient programs, or post-harvest loss. The numbers are planning estimates, not guarantees.
After running the calculator, you will know whether your current wattage is matched to your canopy, which grow style costs less in electricity per cycle, and whether your plant count is within the correct density range for your method.
Use the Tool
Plant Density & Canopy Yield Estimator
Sea of Green (SOG) vs Screen of Green (SCROG) — optimize your grow space
| Canopy Size | Style | Plant Count | Est. Yield | @ 600W (g/W) |
|---|
Before you start, have your tent’s interior floor dimensions in feet (length and width, not the outer tent size), your total grow light wattage (the combined draw of all fixtures, not the marketed “equivalent” wattage), and a realistic yield target for your setup. If you are comparing supplemental lighting options for a larger grow, the greenhouse supplemental lighting guide covers footprint matching in more detail.
Quick Start (60 Seconds)
- Tent Length (ft): Measure the usable canopy floor, not the outside tent wall. A 4×4 marketed tent typically has a 3.9×3.9 ft interior; use your actual measured number. Enter values between 1 and 50.
- Tent Width (ft): Same rule as length. If your grow space is not square, enter the actual shorter and longer dimensions separately. Do not average them.
- Grow Style: Select SOG (Sea of Green) if you run many small plants flipped early, or SCROG (Screen of Green) if you train fewer plants through a horizontal net. If you are unsure which applies, SOG = 2 to 4 plants per square foot; SCROG = 0.25 to 1 plant per square foot.
- Target Yield (g/sq ft): Enter your realistic target in grams per square foot of canopy, not total grams. A common starting point for LED systems is 50 g/sq ft. The valid entry range is 10 to 300. Do not enter a total gram goal here.
- Total Light Wattage (W): Use the actual power draw listed on the driver label or product spec sheet. Do not use the “replaces X watt HPS” marketing claim. If you run two 400W fixtures, enter 800. Valid range is 50 to 10,000 W.
Inputs and Outputs (What Each Field Means)
| Field | Unit | What It Means | Common Mistake | Safe Entry Guidance |
|---|---|---|---|---|
| Tent Length | ft | The interior length of your canopy footprint | Using outside tent dimensions instead of inside floor measurement | Measure from wall to wall on the inside; enter 1 to 50 |
| Tent Width | ft | The interior width of your canopy footprint | Swapping length and width on non-square tents (makes no difference to area, but confirms you are measuring both) | Use actual measured width, not the tent model number; enter 1 to 50 |
| Grow Style | SOG / SCROG | Determines the density range used to estimate plant count | Selecting SCROG because it sounds more advanced when plant count and cloning capacity actually favor SOG | SOG if you flip within 2 weeks of canopy fill; SCROG if you train a net for 6 to 8 weeks |
| Target Yield | g/sq ft | Your expected grams of dry flower per square foot of filled canopy | Entering a total gram target instead of a per-square-foot rate; or using breeder “potential yield” numbers which assume perfect conditions | Start with 40 to 60 g/sq ft for a realistic LED indoor baseline; enter 10 to 300 |
| Total Light Wattage | W | Actual combined power draw of all grow lights in the space | Using “equivalent” or “replaces X watt” marketing wattage instead of actual driver draw | Check the driver label or product data sheet; enter 50 to 10,000 W |
| Canopy Area (output) | sq ft | Length x Width; the total footprint the tool uses for all subsequent calculations | Assuming canopy area is floor area when plants do not fill every corner | If your canopy does not fill the tent, reduce the dimensions to the actual lit coverage area |
| Estimated Yield (output) | g and oz | Canopy Area x Target Yield; a planning estimate assuming 100% canopy fill | Treating this as a guaranteed outcome rather than a ceiling under ideal conditions | Apply a conservative fill factor mentally; uneven canopies yield less |
| Grams per Watt (output) | g/W | Estimated Yield divided by total wattage; a standardized efficiency benchmark | Comparing g/W across different light types without noting that HPS and LED baselines differ | LED benchmark is 1.0 g/W or higher; below 0.5 g/W signals a light-to-canopy mismatch |
Light intensity expressed in W/sq ft is a quick proxy, but for a deeper look at how your light spectrum and intensity translate into usable photons at the canopy, the DLI calculator converts your fixture’s PPFD reading and photoperiod into the daily light integral your plants are actually receiving.
Worked Examples (Real Numbers)
Example 1: Standard 4×4 SOG with 600W LED
- Tent Length: 4 ft
- Tent Width: 4 ft
- Grow Style: SOG
- Target Yield: 50 g/sq ft
- Total Wattage: 600 W
Result: Canopy area = 16 sq ft. Estimated yield = 800 g (28.2 oz). g/W = 1.33. Plant range = 32 to 64. SOG veg electricity cost = $19.66. W/sq ft = 37.5 (optimal range).
This setup clears the 1.0 g/W LED benchmark comfortably. With 37.5 W/sq ft of light coverage, the canopy is well within the 30 to 50 W/sq ft optimal band. SOG allows a flip after approximately 14 days of veg at a total vegetative electricity cost under $20.
Example 2: 4×8 SCROG with 1000W LED
- Tent Length: 4 ft
- Tent Width: 8 ft
- Grow Style: SCROG
- Target Yield: 60 g/sq ft
- Total Wattage: 1000 W
Result: Canopy area = 32 sq ft. Estimated yield = 1,920 g (67.7 oz). g/W = 1.92. Plant range = 8 to 32. SCROG veg electricity cost = $130.56. W/sq ft = 31.25 (acceptable).
The g/W outcome looks strong, but the full picture includes $130.56 in electricity burned over 56 days of 18-hour veg before a single flower site initiates. SOG at the same wattage and yield target would reach the same harvest weight while spending $32.76 on veg electricity, saving $97.80 per cycle.
Example 3: 3×3 SOG with 400W LED, Conservative Yield Target
- Tent Length: 3 ft
- Tent Width: 3 ft
- Grow Style: SOG
- Target Yield: 40 g/sq ft
- Total Wattage: 400 W
Result: Canopy area = 9 sq ft. Estimated yield = 360 g (12.7 oz). g/W = 0.90. Plant range = 18 to 36. SOG veg cost = $13.10. W/sq ft = 44.4 (optimal).
At 0.90 g/W, this setup sits just below the 1.0 g/W LED benchmark. The light intensity is well-matched to the canopy at 44.4 W/sq ft, so the efficiency gap comes from the conservative 40 g/sq ft yield target. Raising the target to 45 g/sq ft or upgrading to a 450W fixture would push g/W to 1.0 without changing anything else.
Reference Table (Fast Lookup)
All yield estimates assume 50 g/sq ft. Electricity costs use $0.13/kWh, 18-hour photoperiod, 14-day SOG veg, and 56-day SCROG veg. Light wattage per row reflects practical fixture recommendations for that tent size.
| Tent Size | Sq Ft | Style | Plant Range | Yield (50 g/sqft) | g/W (at fixture W) | SOG Veg Cost | SCROG Veg Cost |
|---|---|---|---|---|---|---|---|
| 2×2 | 4 | SOG | 8 to 16 | 200 g / 7.1 oz | 0.50 at 400W | $13.10 | $52.42 |
| 3×3 | 9 | SOG | 18 to 36 | 450 g / 15.9 oz | 0.75 at 600W | $19.66 | $78.62 |
| 4×4 | 16 | SOG | 32 to 64 | 800 g / 28.2 oz | 1.33 at 600W | $19.66 | $78.62 |
| 4×4 | 16 | SCROG | 4 to 16 | 800 g / 28.2 oz | 1.33 at 600W | $19.66 | $78.62 |
| 4×8 | 32 | SOG | 64 to 128 | 1,600 g / 56.4 oz | 1.60 at 1000W | $32.76 | $131.04 |
| 4×8 | 32 | SCROG | 8 to 32 | 1,600 g / 56.4 oz | 1.60 at 1000W | $32.76 | $131.04 |
| 5×5 | 25 | SCROG | 7 to 25 | 1,250 g / 44.1 oz | 1.25 at 1000W | $32.76 | $131.04 |
| 5×10 | 50 | SCROG | 13 to 50 | 2,500 g / 88.2 oz | 1.25 at 2000W | $65.52 | $262.08 |
| 10×10 | 100 | SOG | 200 to 400 | 5,000 g / 176.4 oz | 1.25 at 4000W | $131.04 | $524.16 |
Key takeaway from the table: At the same canopy size and yield target, SOG and SCROG produce identical gram estimates. The divergence lives entirely in the veg period: plant count, time to flower, and electricity consumed before a single gram is produced.
How the Calculation Works (Formula + Assumptions)
Show the calculation steps
- Canopy Area (sq ft) = Length x Width
Straightforward multiplication. Both inputs are in feet; the result is square feet. Rounding rule: display to one decimal place. - Plant Count Range
SOG: minimum = Area x 2.0, maximum = Area x 4.0. SCROG: minimum = Area x 0.25, maximum = Area x 1.0. Results are rounded up to whole plants using ceiling rounding, since a partial plant slot requires a full plant. The midpoint of the range is displayed as the recommended count. - Estimated Yield (g) = Canopy Area x Target Yield (g/sq ft)
Rounded to the nearest whole gram. Ounce conversion: grams divided by 28.35, displayed to one decimal place. - Grams per Watt = Estimated Yield / Total Wattage
Displayed to two decimal places. This is a planning ratio, not an efficiency score from measured data. - Veg Electricity Cost ($) = (Watts / 1000) x 18 x Veg Days x $0.13
SOG veg days = 14. SCROG veg days = 56. Rate used = $0.13/kWh (US average as of calculation date). Displayed to two decimal places. Both SOG and SCROG costs are computed regardless of which style is selected, enabling direct comparison. - Light Coverage (W/sq ft) = Total Watts / Canopy Area
Displayed to one decimal place. Threshold bands: below 20 W/sq ft triggers a danger flag; 20 to 30 triggers a caution; 30 to 50 is optimal; above 50 triggers a light-burn warning.
Assumptions and Limits
- The yield estimate assumes 100% canopy fill. Sparse coverage, uneven training, or dead zones in the light footprint reduce actual yield without changing the calculation.
- g/W uses total fixture wattage, not wall draw adjusted for driver losses or heat load. Actual wall draw may be 5 to 15 W higher per fixture than the rated output.
- The electricity cost calculation assumes a constant $0.13/kWh. Rates vary significantly by region and time-of-use tariff. Adjust mentally for your actual rate.
- SOG veg period is assumed at 14 days. Some cultivars require 10 days; others need 21. SCROG veg is assumed at 56 days (8 weeks). Large canopies or slow-growing genetics may require 10 to 12 weeks.
- Plant density ranges are based on standard indoor photoperiod cultivation. Autoflowering strains are typically run at lower density and may not follow these ranges.
- This tool does not model multi-layer or vertical growing systems where canopy area and light footprint interact differently.
- Ounce conversion uses 28.35 g/oz (dry weight standard). Wet weight at harvest will be significantly higher.
- The tool does not account for nutrient costs, substrate costs, or labor. Electricity is one variable in the full cycle cost picture.
Standards, Safety Checks, and “Secret Sauce” Warnings
Critical Warnings
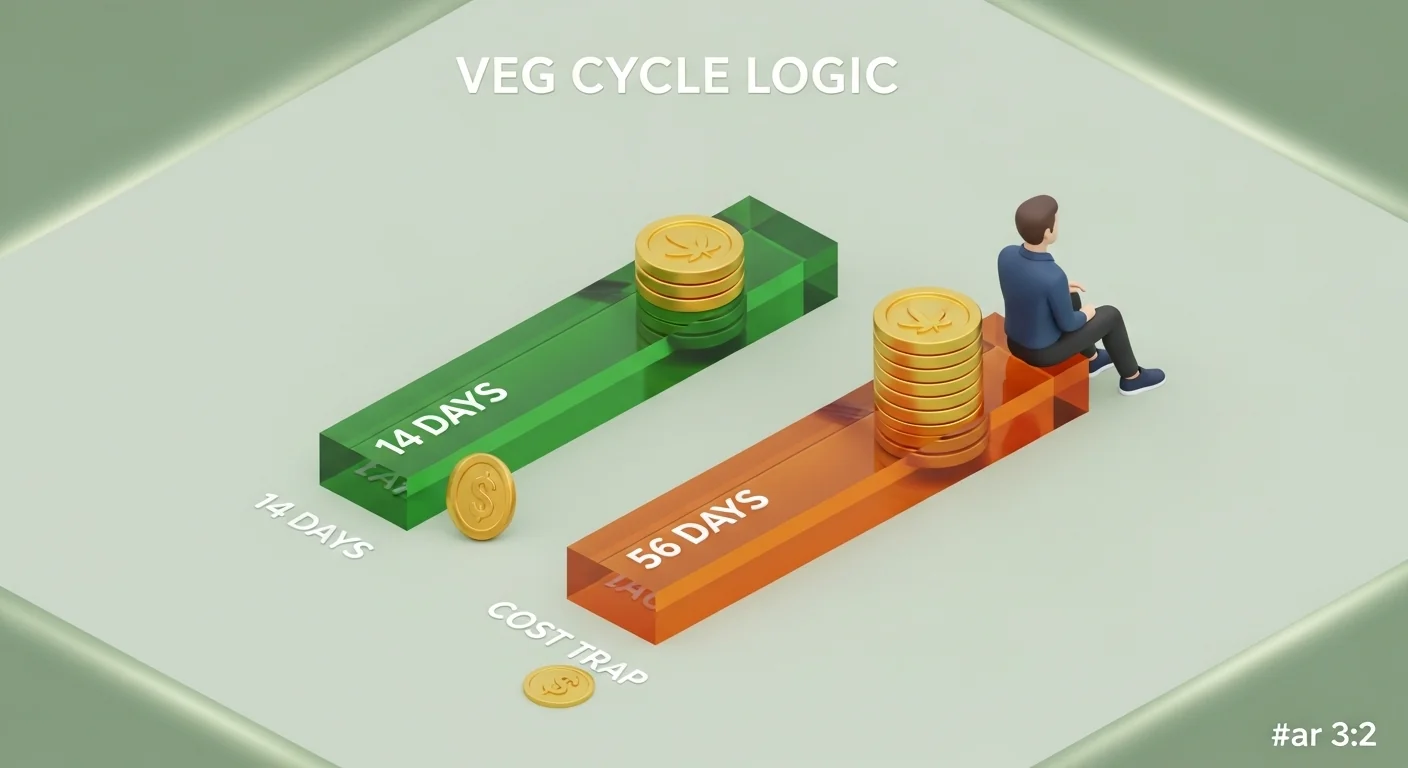
- The SCROG Veg Electricity Trap: A 4×4 tent running a 600W LED on an 8-week SCROG veg consumes approximately 78 kWh before the first day of flower. At $0.13/kWh, that is $78.62 in electricity for vegetative growth alone, plus 56 days of calendar time. The same wattage, same canopy, and the same yield target under SOG completes its veg cycle in 14 days for $19.66. The tool surfaces this number explicitly because most yield calculators treat veg electricity as zero.
- Cloning Capacity Bottleneck in High-Density SOG: A 4×4 tent at maximum SOG density requires 64 plants. Continuous SOG cycling demands a permanent cloning pipeline. Without an aeroponic or propagation system capable of producing clones on a 14-day rotation, the SOG veg advantage collapses into irregular harvest gaps. Plant count at the high end of the density range is only sustainable with active clone production.
- Below 0.5 g/W: A Lighting Problem, Not a Technique Problem: If the calculator returns a g/W below 0.5, the issue is almost always a mismatch between light output and canopy size, not grow style or plant count. Swapping SOG for SCROG will not fix an under-lit canopy. The correct fix is to reduce the canopy footprint or increase fixture wattage.
- Light Intensity Above 50 W/sq ft: The tool flags this as a caution zone. While high-intensity LEDs can support above 50 W/sq ft with CO2 supplementation and precise vapor pressure deficit management, without those environmental controls, light intensities in this range risk photo-bleaching at the top of the canopy and uneven penetration below.
Minimum Standards
- Minimum g/W threshold for LED: 1.0 g/W. Below 0.75 g/W warrants a lighting audit before the next cycle.
- Minimum light coverage: 30 W/sq ft. Below this level, canopy penetration is insufficient for dense SOG fills.
- SOG minimum veg duration: enough time for the canopy to fill the footprint, typically 10 to 21 days depending on plant size at transplant and cultivar growth rate.
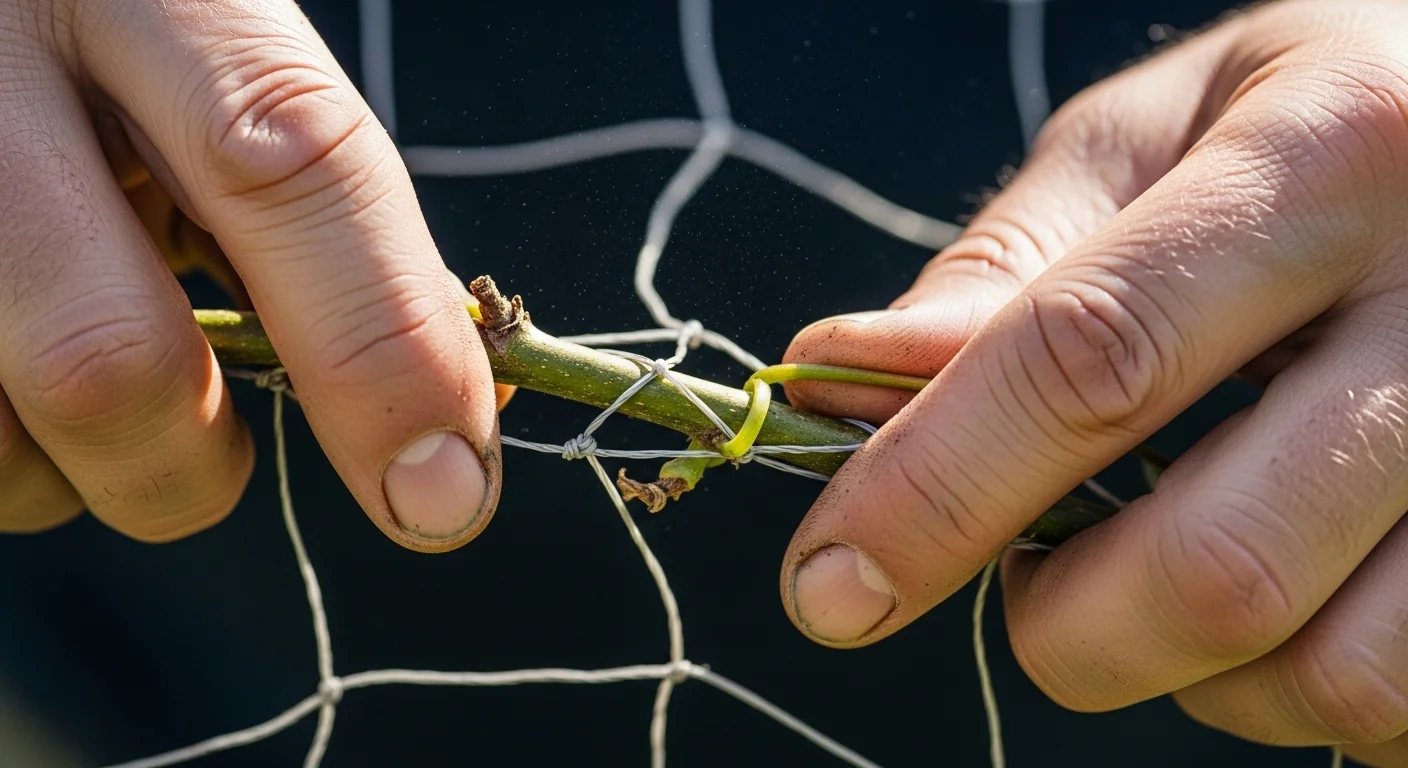
- SCROG net should be set at 20 to 30 cm above the container tops to allow adequate branching volume below the screen before training begins.
Competitor Trap: Most sea of green calculators online return a plant count and a yield number and stop there. They treat both SOG and SCROG as equivalent methods that differ only in plant count. The calculation that exposes the real difference is the vegetative electricity cost: not a subtle variable, but a number that can exceed $100 per cycle in a mid-size tent running SCROG. Growers who choose SCROG for “better yield” without running this number are often paying more in electricity and waiting twice as long to reach flower for the same harvest weight a well-executed SOG would have produced in half the time.
To see your full operating cost picture beyond veg electricity, the grow light cost calculator breaks down monthly fixture running costs across the entire cycle. For climate control sizing, a correctly sized air conditioning unit is essential when running high-wattage setups in sealed rooms; the grow room AC sizing tool calculates the BTU load your lights contribute to the ambient heat budget.
Common Mistakes and Fixes
Mistake: Entering “Equivalent” Wattage Instead of Actual Draw
LED fixture marketing frequently lists a “replaces 1000W HPS” claim while the actual driver draw is 400 to 600W. Entering 1000W into the wattage field inflates the g/W result and makes a setup appear more efficient than it is. It also distorts the W/sq ft calculation, potentially masking an under-lit canopy.
Fix: Use only the actual wattage printed on the driver label or listed in the product’s technical specifications, never the marketing equivalent claim.
Mistake: Ignoring Plant Count When Choosing SCROG for a Small Tent
SCROG is often selected because it seems like the “professional” method, but a 4×4 tent under SCROG density (0.25 to 1 plant/sq ft) means running 4 to 16 plants through 8 weeks of training. That same tent under SOG can be producing flowers in 2 weeks with 32 to 64 plants sourced from a continuous clone cycle. The method choice should follow operational capacity, not perceived prestige.
Fix: Compare the veg cost output for both styles using this tool and select based on your actual cloning infrastructure and schedule tolerance.
Mistake: Assuming Canopy Area Equals Tent Floor Area
Plants placed against tent walls, dead spots under the edges of a light fixture, or containers grouped in the center of a larger tent all reduce the effectively filled canopy below the nominal tent dimensions. Using full tent dimensions in a partially-filled setup overstates yield estimates.
Fix: Measure only the area actually covered by the light footprint and occupied by plants. If your 4×8 tent has an effective lit canopy of 3.5×7.5, enter those numbers. High plant density in the core of a tent also raises relative humidity sharply; once you have your plant count, use the dehumidifier sizing calculator to check whether your current extraction is adequate for the transpiration load.
Mistake: Using Breeder Yield Claims as the Target Yield Input
Breeder-reported yields are ceiling estimates under ideal, controlled conditions with experienced operators. Entering 120 g/sq ft because a seed company advertised it produces an unrealistic output that will mislead both plant count planning and g/W benchmarking.
Fix: Use 40 to 60 g/sq ft as a realistic LED baseline for an established indoor operation. Scale up only after achieving that target consistently across multiple cycles.
Mistake: Not Accounting for Ventilation Capacity When Increasing Plant Density
Doubling plant count in a fixed footprint doubles transpiration, which raises vapor pressure deficit requirements and airflow needs. Growers who scale from SCROG to high-density SOG without resizing ventilation regularly encounter humidity-related issues mid-flower. The yield calculation is only one part of the readiness check.
Fix: After finalizing plant count, verify that your extraction fan is correctly sized for the new canopy density using the tent fan size calculator before committing to the next cycle plan.
Next Steps in Your Workflow
Once you have your canopy area, yield estimate, and g/W output, the logical next step is environmental calibration. g/W and W/sq ft tell you whether your light is matched to the space, but they say nothing about how well your plants are actually using that light. Vapor pressure deficit is the lever that controls how aggressively plants transpire and uptake nutrients across both veg and flower. Running the VPD calculator with your current temperature and relative humidity will show whether your environment is allowing the canopy to operate efficiently, or whether suboptimal VPD is capping your yield below what the plant density and wattage can theoretically deliver.
After VPD, the next bottleneck is usually the balance between irrigation, substrate, and nutrient delivery, particularly if you are running high plant counts in small containers under SOG. Timing and duration of feed cycles directly affect root zone oxygen, which drives growth rate in the veg period and canopy fill rate. The crop steering calculator is a useful companion tool for dialing in the generative-to-vegetative balance during the transition from late veg into early flower, especially in coco and hydroponic systems where ionic balance shifts rapidly around the flip.
FAQ
How many plants do I need for a 4×4 Sea of Green?
Using the SOG density range of 2 to 4 plants per square foot, a 4×4 tent with 16 square feet of canopy requires 32 plants at the low end and 64 plants at the high end. The typical starting point is the midpoint of that range, around 48 plants, though actual count depends on container size, cultivar stretch, and how quickly individual plants fill their canopy slot.
What is a good grams per watt result for LED?
The widely accepted LED benchmark is 1.0 g/W or higher. Results between 0.75 and 1.0 g/W are considered acceptable for a well-running setup. Below 0.5 g/W indicates a fundamental mismatch: the canopy is likely larger than the light can support efficiently, or yield targets are set below what the fixture is capable of delivering given its actual footprint.
Does SCROG produce more yield than SOG?
At the same canopy area and yield target, the calculator produces identical gram estimates for both methods because yield depends on filled canopy area and grams per square foot, not on how many plants fill that area. The real differences between methods are plant count, veg duration, electricity cost, and operational complexity. Neither method inherently outyields the other per square foot of properly filled canopy.
Why does SCROG cost more electricity per cycle?
SCROG requires 6 to 8 weeks of vegetative growth under 18-hour lighting to train and fill the horizontal screen before switching to flower. SOG flips much earlier, typically after 1 to 2 weeks. Both methods consume the same wattage per hour during veg, but the longer SCROG veg period multiplies that hourly cost across 4 to 6 additional weeks, producing a significantly higher per-cycle electricity cost before flowering begins.
What W/sq ft should I target for indoor cannabis?
The calculator flags 30 to 50 W/sq ft as the optimal range for LED grow lighting in a canopy-filled tent. Below 30 W/sq ft is generally considered under-lit for dense canopies. Above 50 W/sq ft creates light intensity that most strains can only utilize effectively with elevated CO2 levels and precise environmental controls. For most home and small commercial growers, 35 to 45 W/sq ft is a practical target.
Can I use this calculator for autoflowering strains?
The yield formula applies regardless of strain type: canopy area multiplied by target yield per square foot. However, the plant density ranges and veg cost calculations are based on photoperiod cultivation. Autoflowering plants are typically run at lower densities than photoperiod SOG due to their fixed lifecycle, and they do not have a controlled vegetative period where the 14-day or 56-day assumptions apply. Use the yield and g/W outputs, and disregard the plant count ranges and veg electricity comparison for autos.
Conclusion
The core differentiator in this tool is not the yield estimate, which any basic square-footage calculator can produce, but the vegetative electricity cost comparison that most grow calculators omit entirely. Choosing between SOG and SCROG without knowing what each method costs in electricity before flower is making a yield-based decision with only half the data. At common wattages, the difference between 14 days and 56 days of veg lighting represents real money per cycle, and that gap widens as wattage increases.
The single most common mistake this tool surfaces is growers running SCROG in mid-size tents under the assumption that fewer, larger plants are easier to manage, without realizing that each SCROG cycle locks the grow room into 8 weeks of veg electricity before a single hour of flower lighting begins. If the numbers after running the calculator suggest SOG is the more efficient method for your space and wattage, the practical follow-through is building a stable clone pipeline. For the nutrient side of that equation, the hydroponic EC calculator helps dial in solution strength across veg and flower stages to match the higher nutrient uptake rate that dense SOG canopies demand.
Lead Data Architect
Umer Hayiat
Founder & Lead Data Architect at TheYieldGrid. I bridge the gap between complex agronomic data and practical growing, transforming verified agricultural science into accessible, mathematically precise tools and guides for serious growers.
View all tools & guides by Umer Hayiat →


