
When a shovel goes into heavy soil and comes back with a slick, plastic-feeling clod that smears rather than crumbles, that is not “dense” soil. It is a specific physical reality defined by particle-size ratios, and it carries a precise set of hydraulic consequences. The USDA Soil Texture Triangle translates those three numbers — sand, silt, and clay percentages — into a texture class that predicts drainage rate, water retention, and root health risk with engineering-grade precision. No guesswork required.
This calculator takes the four inputs your soil profile requires (sand %, silt %, clay %, and rooting depth in inches), classifies the soil against the full 12-class USDA system, and returns the Available Water Capacity (AWC) in inches of plant-available water per foot of depth. It also plots your soil on a visual texture triangle and fires deterministic warnings when clay percentage crosses critical thresholds. What it does not do is account for organic matter content, coarse rock fragment correction, salinity, or structural aggregation — those are lab-dependent corrections beyond a particle-size-only model.
After running this calculator, you will know your USDA texture class, how many inches of plant-available water your root zone holds, whether your soil falls in the clay pan danger zone, and exactly what compost volume is needed to shift toward a Loam or Clay Loam profile.
Use the Tool
Soil Texture Triangle & Water Holding Sizer
The Yield Grid · USDA Soil Texture Calculator with Available Water Capacity
▲ USDA Soil Texture Triangle — orange dot shows your soil
| Texture Class | AWC (in/ft) | Drainage | Plant Suitability |
|---|
How This Calculator Works — Formula & Assumptions
- Step 1 — Validate inputs: Sand%, Silt%, and Clay% must each be between 0 and 100. Their sum must equal exactly
100%. If not, the calculator triggers an error. - Step 2 — USDA texture class lookup: The three percentages are used to locate your soil on the USDA Soil Texture Triangle. The triangle is divided into 12 official texture classes (Sand, Loamy Sand, Sandy Loam, Sandy Clay Loam, Sandy Clay, Clay, Silty Clay, Silty Clay Loam, Clay Loam, Loam, Silt Loam, Silt). The class is determined by a priority-ordered boundary check.
- Step 3 — Available Water Capacity (AWC): Each USDA class is assigned a representative AWC value (inches of plant-available water per foot of soil depth) sourced from USDA NRCS Soil Survey data. This represents water held between field capacity (~-0.033 MPa) and permanent wilting point (~-1.5 MPa).
- Step 4 — Total AWC:
Total AWC = AWC (in/ft) × Depth (ft)where Depth (ft) = Depth (in) ÷ 12. - Step 5 — Warnings: If Clay% ≥ 40%, the heavy clay asphyxiation warning fires. If Clay% ≥ 30%, drainage warnings appear. If Sand% ≥ 70%, low water retention warnings appear.
- Assumptions: AWC values are representative medians; actual values depend on organic matter content, bulk density, and compaction. No coarse fragment correction is applied. AWC does not account for salinity or pH effects on plant-available water.
Assumptions & Limits
- Sand, Silt, and Clay must sum to exactly 100%. Rounding errors of ±0.1% are tolerated.
- AWC values are NRCS representative ranges; field conditions vary by compaction, organic matter, and tillage history.
- The USDA triangle boundaries used here follow the standard 12-class system. Soils near class boundaries may behave differently depending on local pedology.
- This tool does not account for coarse rock fragments (gravels) which reduce effective AWC.
- Organic matter amendments (compost volume recommendations) are approximate targets for initial soil improvement, not prescriptions.
- Consult a certified soil scientist or your local Cooperative Extension office for site-specific management advice.
- Soil depth entered should represent the effective root zone, not total profile depth.
Before entering values, have three pieces of data ready: the results of a jar test or professional lab particle-size analysis (reported as sand %, silt %, and clay % that sum to 100), and a measurement of the rooting depth you want to evaluate in inches. If you are working with a purchased "topsoil" blend, request the particle-size breakdown from the supplier before assuming it is garden-quality material. For projects where total fill volume matters alongside texture, the raised bed soil calculator pairs directly with the outputs here.
Quick Start (60 Seconds)

- Sand %: Enter the sand fraction from your particle-size report. Sand particles are 0.05 to 2.0 mm. Common mistake: confusing "coarse soil" feel with high sand -- gravel does not count as sand.
- Silt %: Enter the silt fraction (0.002 to 0.05 mm particles). Silt feels flour-like when dry. Do not conflate silt with fine sand in field estimates.
- Clay %: Enter the clay fraction (particles below 0.002 mm). This is the number that drives most of the hydraulic behavior. Even a 5-percentage-point difference near the 40% boundary can shift texture class dramatically.
- Soil Depth (inches): Enter the effective rooting depth you are managing -- not total profile depth. For vegetable gardens, typical entries are 12 to 18 inches. For turf, 6 to 8 inches.
- Sum check: The three percentages must total exactly 100. The live sum display turns green when the inputs are consistent. Do not proceed until it confirms 100%.
- Units: Depth is in inches only. AWC output is reported in inches of water per foot of soil, consistent with USDA-NRCS Soil Survey conventions.
- Reading the triangle: The orange dot on the USDA triangle shows where your particle-size combination plots. Points near class boundaries are genuinely borderline soils that may behave like either adjacent class.
Inputs and Outputs (What Each Field Means)
| Field | Unit | What It Means | Common Mistake | Safe Entry Guidance |
|---|---|---|---|---|
| Sand % | Percent (0-100) | Fraction of mineral particles in the 0.05-2.0 mm size class; determines macropore volume and drainage speed | Including gravel or rock fragments in the sand fraction | Use fine-earth fraction only (particles passing a 2 mm sieve) |
| Silt % | Percent (0-100) | Fraction of particles 0.002-0.05 mm; primary contributor to AWC and surface crusting risk | Estimating silt by feel rather than using lab data; field estimates for silt are notoriously unreliable | Hydrometer or pipette lab analysis gives the most reliable silt fraction |
| Clay % | Percent (0-100) | Fraction of particles below 0.002 mm; controls plasticity, shrink-swell, cation exchange capacity, and micropore density | Underestimating clay in purchased topsoil; suppliers may report "loam" for soils with 35-50% clay | Request a certified particle-size analysis; the ribbon test gives a rough field check but is not precise enough for AWC calculations |
| Soil Depth (inches) | Inches (1-240) | Effective rooting zone depth being evaluated; used to convert AWC from per-foot rate to total inches of water stored | Using full profile depth instead of effective rooting depth; deep clay layers inaccessible to shallow-rooted crops inflate the total AWC | Measure to the restrictive layer (hardpan, bedrock, water table) or to the practical rooting limit for the target crop |
| USDA Texture Class (output) | Class name | One of 12 official USDA texture classes assigned by boundary-priority lookup on the texture triangle | Assuming "loam" is a specific mixture rather than a class boundary; Loam requires specific ranges for all three fractions simultaneously | Read the reference table to understand typical management for your class |
| AWC (output) | Inches per foot | Plant-available water held between field capacity and permanent wilting point; the NRCS representative value for your texture class | Confusing AWC with total water-holding capacity; total capacity includes water held so tightly roots cannot extract it | AWC values above 1.8 in/ft indicate good retention; below 1.0 in/ft signals irrigation dependency |
| Total AWC (output) | Inches | AWC rate multiplied by depth in feet; represents total inches of plant-available water stored in the evaluated profile | Interpreting high AWC as a reason to reduce irrigation without accounting for evapotranspiration rate | Compare total AWC to crop weekly water demand; a total AWC of 2 inches supports roughly one week of moderate ET without rain |
Worked Examples (Real Numbers)
Scenario 1: A Well-Structured Vegetable Garden Loam
- Sand: 40%
- Silt: 40%
- Clay: 20%
- Soil Depth: 12 inches
Result: Texture class = Loam. AWC = 2.00 in/ft. Total AWC = 2.00 inches (12 in / 12 = 1.0 ft, multiplied by 2.00 in/ft).
This is the benchmark profile. The 40-40-20 distribution places the soil squarely in the Loam class, providing excellent drainage alongside high plant-available water retention. No amendment warnings fire. A garden at this texture with adequate organic matter requires no corrective action.
Scenario 2: Purchased "Premium Topsoil" That Is Actually Heavy Clay
- Sand: 10%
- Silt: 30%
- Clay: 60%
- Soil Depth: 12 inches
Result: Texture class = Clay. AWC = 1.50 in/ft. Total AWC = 1.50 inches. Clay pan asphyxiation warning fires.
Despite the seemingly acceptable AWC number, the physics are dangerous. Micropores dominate the pore space, hydraulic conductivity can drop below 0.06 inches per hour, and the soil swings between waterlogged and brick-hard. The calculator mandates compost incorporation of approximately 4 to 5 inches tilled to the full depth. This is the scenario where the SECRET_SAUCE warning matters most: the product was sold as topsoil, but 60% clay makes it a root growth hazard without aggressive amendment.
Scenario 3: Sandy Raised Bed With Low Water Retention
- Sand: 80%
- Silt: 15%
- Clay: 5%
- Soil Depth: 8 inches
Result: Texture class = Loamy Sand. AWC = 0.90 in/ft. Total AWC = 0.60 inches (8 in / 12 = 0.667 ft, multiplied by 0.90 in/ft).
The total root zone holds less than 0.6 inches of plant-available water. In a warm climate with an evapotranspiration rate of 0.2 inches per day, this bed reaches wilting point in roughly three days without irrigation or rain. Daily watering is functionally mandatory. A 3 to 4 inch compost amendment tilled to depth would shift this profile toward Sandy Loam (AWC approximately 1.40 in/ft), doubling the water reserve.
Reference Table (Fast Lookup)
| USDA Texture Class | Typical Clay Range | AWC (in/ft) | Total AWC at 12 in depth (inches) | Drainage Category | Primary Management Priority |
|---|---|---|---|---|---|
| Sand | <7% clay, >70% sand | 0.60 | 0.60 | Excellent | Organic matter; frequent irrigation |
| Loamy Sand | <7% clay, 60-85% sand | 0.90 | 0.90 | Very good | Compost additions; mulching |
| Sandy Loam | 7-20% clay, >43% sand | 1.40 | 1.40 | Good | Moderate irrigation; organic matter beneficial |
| Sandy Clay Loam | 20-35% clay, >45% sand | 1.50 | 1.50 | Moderate | Monitor compaction; aerate annually |
| Sandy Clay | >35% clay, >45% sand | 1.20 | 1.20 | Poor | Compost + gypsum; raised bed conversion |
| Loam | 7-27% clay, mixed sand/silt | 2.00 | 2.00 | Good | Maintain organic matter; benchmark class |
| Clay Loam | 27-40% clay | 1.80 | 1.80 | Moderate | Core aeration; annual compost topdress |
| Silty Clay Loam | 27-40% clay, >40% silt | 1.90 | 1.90 | Moderate | Avoid tillage when wet; mulch to prevent crust |
| Silty Clay | >40% clay, >40% silt | 1.40 | 1.40 | Poor | Aggressive compost; no foot traffic when saturated |
| Clay | >40% clay | 1.50 | 1.50 | Very poor | Mandatory amendment; clay pan warning applies |
| Silt Loam | 7-27% clay, >50% silt | 2.10 | 2.10 | Good | Surface mulch to prevent erosion and crusting |
| Silt | <12% clay, >80% silt | 2.00 | 2.00 | Moderate | Erosion control; avoid bare soil surface |
How the Calculation Works (Formula and Assumptions)
Show the calculation steps
Step 1: Input validation. Sand, Silt, and Clay must each be between 0 and 100. Their sum must equal 100 within a tolerance of plus or minus 0.15 percentage points. If the sum deviates beyond this tolerance, the calculator blocks execution and flags the error inline. No silent rounding is applied.
Step 2: USDA texture class lookup. The three percentages are evaluated against the official USDA 12-class boundary system using a priority-ordered conditional sequence. Clay-dominated boundaries are checked first (Clay at 40%+, Sandy Clay, Silty Clay) because they involve the most restrictive hydraulic consequences. Mixed and silt-dominated classes follow. The priority order ensures borderline soils are assigned the most ecologically accurate class, not just the first geometric match.
Step 3: AWC assignment. Each texture class is assigned a representative AWC value (in inches per foot) drawn from USDA-NRCS Soil Survey literature. These values represent water held between field capacity (approximately -0.033 MPa matric potential) and permanent wilting point (approximately -1.5 MPa). The values are class medians, not upper bounds.
Step 4: Total AWC calculation. Total AWC (inches) = AWC (in/ft) x [Depth (inches) / 12]. The depth conversion to feet is internal. Rounding follows standard decimal precision to two places.
Step 5: Warning logic. A clay pan warning fires when clay exceeds 40%. Drainage and compaction warnings fire at clay above 30%. Low retention warnings fire when sand exceeds 70% or AWC falls below 0.8 in/ft. A silt crusting warning fires when silt exceeds 70%. These thresholds are deterministic, not probabilistic.
Assumptions and Limits
- AWC values are NRCS representative class medians. Actual AWC in any given field varies with organic matter content, bulk density, tillage history, and structural aggregation.
- No coarse fragment correction is applied. Soils with significant gravel or rock content will have lower effective AWC than the calculator reports. For gravel-heavy profiles, subtract fractional volume occupied by coarse fragments before entering the depth.
- The calculation assumes the entire entered depth has uniform texture. Layered or stratified profiles (common in disturbed or fill soils) cannot be accurately captured in a single-layer model.
- Salinity and pH effects on plant-available water are not included. Sodic soils with high exchangeable sodium percentage can have severely impaired hydraulic conductivity even in texture classes that would otherwise indicate good drainage.
- The 12-class USDA boundary system is applied here using a simplified geometric priority. Soils that plot precisely on a class boundary line may be assigned differently than a certified soil scientist using physical clay type assessment.
- Field-estimated sand/silt/clay percentages (jar test, ribbon test, texture by feel) carry significant uncertainty, often plus or minus 5 to 10 percentage points. This can shift the assigned class by one or two categories and meaningfully alter AWC output. Lab-confirmed particle-size analysis is the recommended input source.
- The compost volume recommendations generated by the warning system are approximate targets for first-amendment events, not precise prescriptions. Soil type, compaction depth, and existing organic matter content all affect the required rate.
Standards, Safety Checks, and Secret Sauce Warnings
Critical Warnings
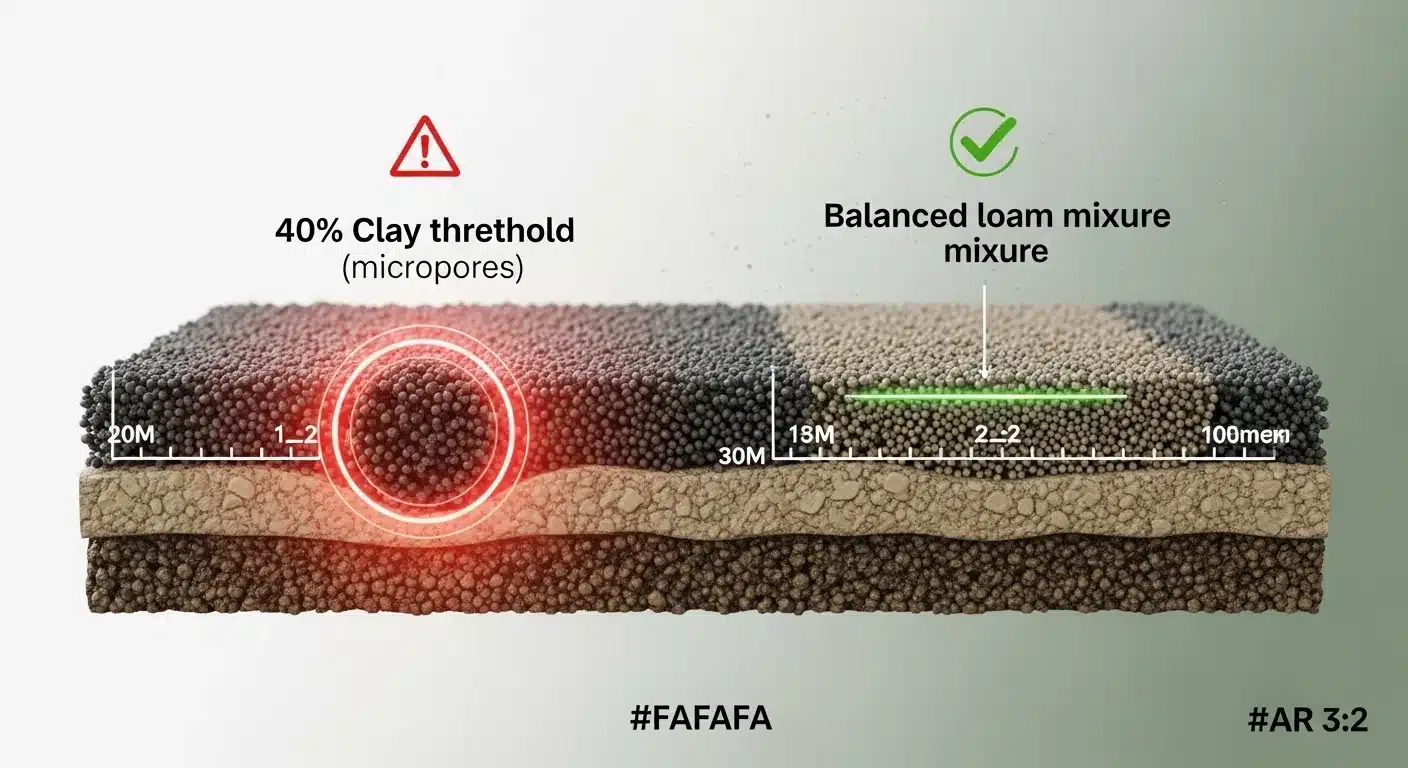
- Clay pan asphyxiation (clay above 40%): Micropores dominate the pore space in soils above 40% clay. Hydraulic conductivity can fall below 0.06 inches per hour, far below the 0.5 inches per hour minimum required for healthy root respiration. The paradox is visible: the soil may show a numerically acceptable AWC (1.5 in/ft) while simultaneously waterlogging roots during rain and baking to pottery hardness in drought. The AWC number does not capture the speed at which water moves. Clay at this level is a drainage and aeration failure regardless of retention capacity.
- Silt crust formation (silt above 70%): High-silt soils are vulnerable to surface sealing after rain or overhead irrigation. The fine particles rearrange into a nearly impermeable crust that impedes seedling emergence and infiltration. AWC values for Silt and Silt Loam classes are excellent, but those numbers are meaningless if water cannot enter the profile in the first place. Permanent surface mulch is a structural requirement, not an optional improvement.
- Low total AWC (below 0.5 inches in root zone): When total AWC falls below half an inch across the entire evaluated profile, the soil cannot buffer even one warm day of crop water demand in most climates. This condition typically occurs in shallow sandy profiles and requires either deep organic matter incorporation or daily irrigation management.
- Purchased topsoil verification: Retail and bulk topsoil products are frequently described as "loam" by suppliers when they contain 35 to 55% clay. This calculator should be run on any unverified fill material before planting. The soil bulk density calculator provides a complementary check: true loam has a bulk density near 1.2 to 1.4 g/cm3, while compacted clay-heavy fill typically exceeds 1.6 g/cm3.
Minimum Standards
- Target texture class for most vegetables and ornamentals: Loam, Sandy Loam, Silt Loam, or Clay Loam. AWC should be 1.4 in/ft or above.
- Minimum hydraulic conductivity for functional root growth: 0.5 in/hr. Heavy clay (above 40% clay) routinely fails this standard without amendment.
- Organic matter targets for AWC improvement: Raising soil organic matter from 1% to 5% can increase AWC by 0.2 to 0.5 in/ft depending on starting texture class. This is why the compost recommendation in the calculator is not optional for clay-dominant soils.
- Depth standard for annual crops: The effective rooting depth input should reflect at least 12 inches for shallow-rooted vegetables and 18 to 24 inches for tomatoes, peppers, and deep-rooted crops. Entering 6 inches for a crop that roots to 18 inches underestimates total available water by 66%.
Competitor trap: Most soil texture tools stop at naming the class. They return "Clay Loam" and leave users with no actionable information. The critical failure is that a Clay Loam at 38% clay and a Clay at 55% clay both receive similar AWC values in simplified lookup tables, but their behavior under irrigation, rain, and drought is categorically different. The AWC number alone cannot distinguish them. This calculator explicitly checks clay percentage against the 40% threshold, explains the hydraulic physics, and calculates the specific compost volume needed to shift the profile -- because the class name alone is not sufficient for a management decision. If you only know your texture class but not your amendment volume, you have incomplete information. For soils where pH interacts with clay activity, the soil pH lime calculator provides the next layer of site-specific math.
Common Mistakes and Fixes
Mistake: Using a Jar Test Estimate as the Only Input
The DIY settling jar test is a useful screening tool, but it produces estimates with plus or minus 10 percentage points of uncertainty in the silt fraction specifically. At 35% clay, a 10-point silt estimation error can move the classification from Clay Loam (manageable) to Silty Clay (requires intervention). The test is useful to confirm whether soil is broadly sandy, silty, or clayey, but it should not be the sole input for AWC calculations that drive amendment decisions.
Fix: Use a certified laboratory particle-size analysis (hydrometer method) for any bed where amendment quantities will exceed two cubic yards.
Mistake: Entering Total Profile Depth Instead of Effective Rooting Depth
A 48-inch soil profile entry will return a reassuringly large total AWC even if the bottom 30 inches are dense clay that roots never penetrate. This creates a false sense of water security. Shallow-rooted crops in a 6-inch effective zone can wilt despite the "48 inches deep" entry showing adequate total AWC.
Fix: Enter the depth to the first restrictive layer (hardpan, clay lens, bedrock, saturated zone) or the documented rooting depth for your specific crop, whichever is shallower.
Mistake: Treating AWC as Equivalent to Total Water Holding Capacity
AWC is the subset of water held between field capacity and permanent wilting point. Soils -- particularly heavy clays -- hold significant additional water that is bound to particle surfaces at tensions roots cannot overcome. A Clay soil at 1.5 in/ft AWC may hold 3+ in/ft of total water, but more than half of it is biologically unavailable. Watering decisions should be based on AWC, not total water content. Soils in the clay textural classes can simultaneously appear moist by feel while being in plant water stress.
Fix: Read AWC alongside drainage category in the reference table. High total water content in a poorly draining class is a warning sign, not a benefit.
Mistake: Assuming the USDA Class Changes Linearly With Clay Percentage
Between 27% and 40% clay, the texture class shifts three times (Sandy Clay Loam, Clay Loam, then Clay) depending on the simultaneous sand and silt fractions. This means a 5-point change in clay percentage can land in a completely different management class. Many gardeners track clay in rough 10-point increments and miss class-critical boundaries entirely. For cation exchange capacity and nutrient management decisions, this non-linearity matters significantly; the CEC calculator quantifies how texture class translates to nutrient-holding ability.
Fix: Use the triangle visualization output to confirm where your specific sand-silt-clay combination actually plots, not just the clay percentage in isolation.
Mistake: Applying Compost Based on Bag Count Instead of Volume-to-Depth Math
The amendment volume needed to meaningfully shift clay percentage decreases as a function of the total soil volume being amended. A 3-inch compost layer tilled to 6 inches has a very different dilution ratio than the same 3-inch layer tilled to 12 inches. Gardeners who apply compost by "bags purchased" rather than by calculated volume typically under-apply by 50% or more, especially for clay-dominant soils where the target is organic matter at 5% or above. The compost volume calculator translates the amendment depth and area into a specific quantity to source.
Fix: Use the compost recommendation from this calculator (expressed as depth of topdress at a specific tilling depth) as the input to a volume calculator before purchasing materials.
Next Steps in Your Workflow
Once you have your USDA texture class and AWC output, the immediate next decision is amendment quantity. For soils classified as Clay, Silty Clay, or Sandy Clay, the compost volume mandated by the clay pan warning should be treated as a minimum, not a target. Incorporate that volume in the fall before the growing season, allow winter freeze-thaw cycles to work the organic matter into the clay matrix, and retest in spring. For soils in the acceptable range (Clay Loam, Loam, Silt Loam), the focus shifts to maintaining organic matter annually. If you are building or filling a new raised bed, running the inputs through the soil mix calculator before purchasing material helps ensure the blend you order will actually test as Loam rather than arriving as clay-heavy fill.
For production-scale or intensive vegetable gardens, texture class is the first layer of a multi-variable soil health profile. Nitrogen availability from organic matter interacts with texture class directly -- clay soils immobilize nitrogen differently than sandy soils -- and the soil organic matter nitrogen release calculator lets you model how much nitrogen your amended organic layer will actually release over the growing season. Treating texture, organic matter, and nitrogen availability as a connected system rather than separate checklists produces noticeably different outcomes by midsummer.
FAQ
What is the USDA Soil Texture Triangle?
The USDA Soil Texture Triangle is a ternary diagram that maps the three mineral particle-size fractions (sand, silt, clay) onto a triangular coordinate system. Each point on the triangle corresponds to a unique combination of the three fractions, and the triangle is divided into 12 named texture classes that define hydraulic and agronomic behavior. It is the standard classification tool used by the USDA Natural Resources Conservation Service for soil survey mapping across the United States.
What is Available Water Capacity and why does it matter?
Available Water Capacity (AWC) is the quantity of water a soil can store between field capacity and permanent wilting point. Field capacity is the water remaining after gravity drainage has slowed (roughly 24 to 48 hours after saturation). Permanent wilting point is the tension at which plant roots can no longer extract water. AWC represents only the water accessible to plants. It matters because it determines how many days a soil can support crop water demand without rain or irrigation.
Can I use a jar test to get inputs for this calculator?
A jar test (mixing soil and water, letting particles settle by size) gives a rough estimate of texture fractions, but silt and fine sand are difficult to distinguish by settling time alone. Estimates from jar tests carry uncertainty of 5 to 15 percentage points, particularly in the silt fraction. For general screening this is adequate, but for calculating amendment volumes on significant planting areas, a certified laboratory particle-size analysis by the hydrometer method is the more reliable input source.
Why does clay percentage matter so much above 40%?
At clay percentages above 40%, micropores become the dominant pore type. These tiny pores hold water at tensions roots cannot overcome, and they also dramatically reduce hydraulic conductivity. The result is a soil that can simultaneously have an acceptable AWC on paper while waterlogging roots in rain and baking hard in drought. The 40% threshold marks a nonlinear shift in hydraulic behavior, which is why the calculator fires a specific warning at that boundary rather than treating all clay percentages as a continuous linear scale.
What is the difference between AWC and water-holding capacity?
Total water-holding capacity is the maximum water a soil pore space can contain at saturation. AWC is a smaller subset -- only the water held between field capacity and permanent wilting point. Heavy clay soils have very high total water-holding capacity but much of that water is bound to clay mineral surfaces at matric potentials below -1.5 MPa, making it biologically unavailable. AWC is the agronomically relevant number because it represents what plants can actually use.
How accurate are the AWC values in this calculator?
The AWC values used here are USDA-NRCS representative class medians from the Soil Survey literature. They reflect typical ranges for each texture class under standard conditions. Actual AWC for any specific field sample varies depending on organic matter content, bulk density, structural aggregation, and mineralogy of the clay fraction. The calculator is accurate to within the class median range but should not be used as a substitute for site-specific laboratory measurement when precision is critical for irrigation system design or crop insurance purposes.
Conclusion
Soil texture drives nearly every other agronomic variable worth measuring: drainage rate, AWC, compaction resistance, cation exchange capacity, and organic matter stability. The USDA triangle is not a theoretical abstraction -- it is the physical foundation that determines whether a garden bed drains in hours or days, whether roots can breathe after a rain event, and whether the "topsoil" purchased for a new bed is genuinely loamy or dangerously clay-heavy. Running three particle-size numbers through this calculator gives a diagnostic picture that guesswork by feel cannot replicate.
The single most critical mistake to avoid is treating all soils below 40% clay as functionally equivalent. A Clay Loam at 38% clay requires different management from a Loam at 22% clay, and the AWC difference alone does not capture the hydraulic conductivity gap between them. The clay pan warning in this tool fires for a reason: not to create alarm, but to trigger the specific volume-based compost math that actually shifts the profile over one or two seasons. For a broader look at the nutrient side of what soil texture class controls, the base saturation calculator connects texture-driven CEC to the cation ratios that determine long-term fertility management.
Lead Data Architect
Umer Hayiat
Founder & Lead Data Architect at TheYieldGrid. I bridge the gap between complex agronomic data and practical growing, transforming verified agricultural science into accessible, mathematically precise tools and guides for serious growers.
View all tools & guides by Umer Hayiat →


