
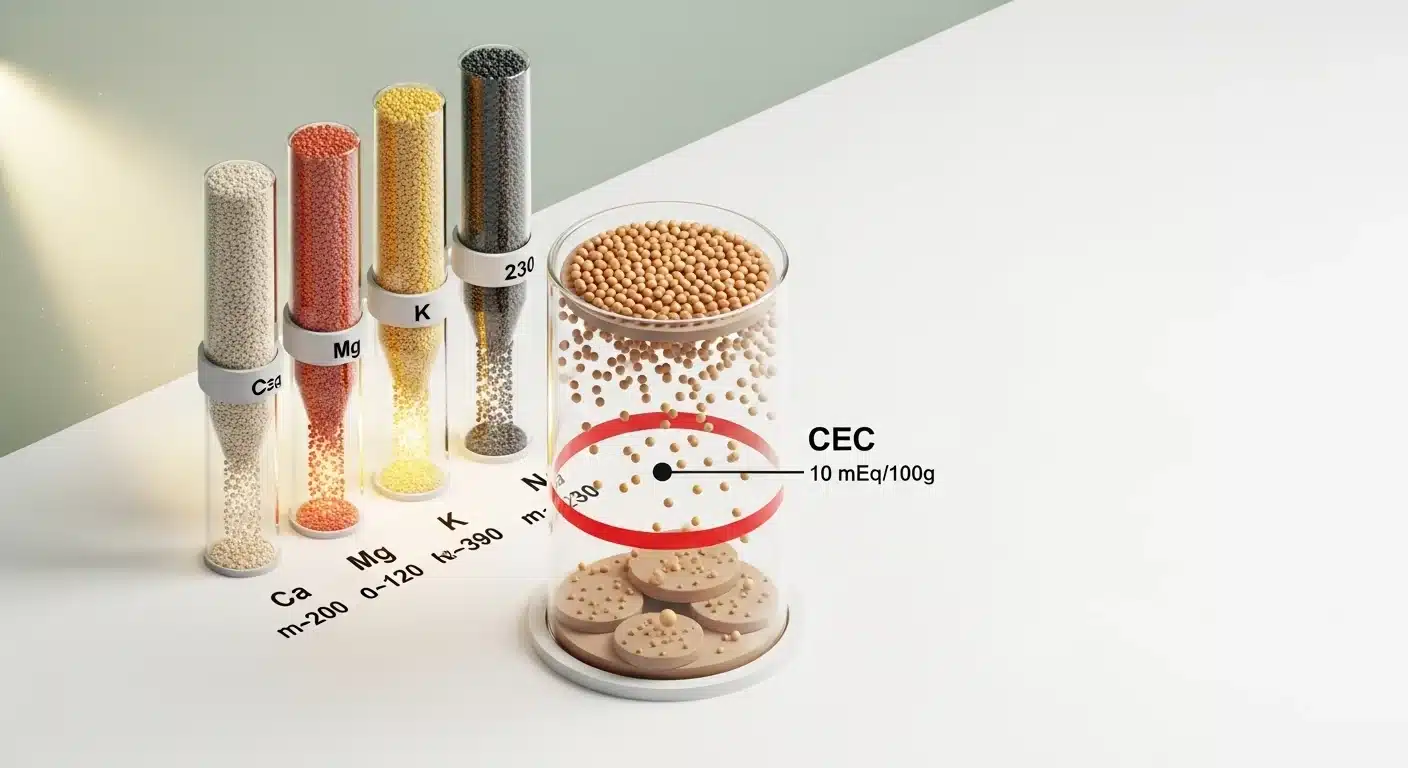
Cation Exchange Capacity is the single number that determines whether your fertilizer investment stays in the root zone or disappears with the first rain. A soil with a CEC of 4 mEq/100g cannot physically hold a full-season potassium application, regardless of how carefully the rate was calculated. Understanding this number before applying any amendment changes the entire decision sequence.
This CEC soil calculator converts your standard soil test report values (ppm for calcium, magnesium, potassium, and sodium, plus exchangeable acidity in mEq/100g) into a complete CEC value and individual base saturation percentages for each cation. It does not predict yield, forecast soil health over time, or replace a certified agronomist’s interpretation. For a focused view of the saturation ratios alone, the base saturation calculator covers that angle directly.
After running the calculator, you will know whether your CEC is high enough to justify a standard fertilizer application schedule, or whether you need to build soil organic matter and CEC first before any meaningful nutrient retention is possible.
Use the Tool
Soil CEC & Base Saturation Calculator
Enter your soil test results to calculate Cation Exchange Capacity and nutrient balance
| Soil Type | CEC Range (mEq/100g) | Interpretation | Fertilizer Retention |
|---|---|---|---|
| Pure Sand | 1 – 5 | Extremely Low | Very Poor — leaches rapidly |
| Sandy Loam | 5 – 10 | Low | Poor — spoon-feed required |
| Loam | 10 – 15 | Moderate | Fair — moderate split applications |
| Clay Loam | 15 – 25 | Good | Good — standard schedules work |
| Clay | 25 – 40 | High | Excellent — long-term reservoirs |
| Organic / Peat | 40+ | Very High | Excellent — watch micronutrient lock |
How This Calculator Works
This calculator converts soil test ppm values into milliequivalents per 100g of soil (mEq/100g), then sums them to compute CEC and individual Base Saturation percentages.
- Calcium mEq: Ca (ppm) ÷ 200 — Ca has atomic weight 40 and valence 2, so meq weight = 20; divide by 1000 × 100 = ÷ 200
- Magnesium mEq: Mg (ppm) ÷ 120 — Mg has atomic weight 24 and valence 2, meq weight = 12; ÷ 120
- Potassium mEq: K (ppm) ÷ 390 — K has atomic weight 39 and valence 1, meq weight = 39; ÷ 390
- Sodium mEq: Na (ppm) ÷ 230 — Na has atomic weight 23 and valence 1, meq weight = 23; ÷ 230
- CEC: Ca_mEq + Mg_mEq + K_mEq + Na_mEq + Acidity_mEq
- Base Saturation %: (Cation_mEq ÷ CEC) × 100 — computed separately for each cation
Units: ppm = mg/kg. Conversion factors follow standard NRCS and University Extension methodology.
Assumptions & Limits
- Conversion factors assume standard mineral soil; organic soils may differ slightly.
- Exchangeable Acidity (H⁺) is entered directly in mEq/100g as reported by a buffered pH lab method (e.g. Mehlich buffer, SMP buffer). Do not convert from pH.
- Sodium is included in total CEC but reported separately. High Na% (>5%) indicates sodic soil conditions and may require gypsum treatment.
- Results are most accurate when all cations are from the same certified soil test lab report.
- This calculator does not account for micronutrients (Fe, Mn, Cu, Zn, B) or organic matter contributions beyond what is reflected in the ppm values.
- Warning thresholds follow Albrecht/NRCS ideal base saturation ratios: Ca 65–75%, Mg 10–20%, K 2–5%.
- The “Sandy Leaching Sieve” alert fires when CEC < 10 mEq/100g.

Before entering values, locate your official soil test report from an accredited lab. You will need the extracted nutrient values in ppm (parts per million) for calcium, magnesium, potassium, and sodium, plus the exchangeable acidity or buffer acidity figure reported in mEq/100g. Do not convert pH to acidity yourself; use the mEq/100g value the lab provides directly. If your report does not list sodium, enter 0 and note that the CEC result will be slightly understated.
Quick Start (60 Seconds)
- Calcium (ppm): Read directly from your lab report’s extracted nutrients table, not from a soil pH section. Typical range is 500 to 4,000 ppm for agricultural soils.
- Magnesium (ppm): Also from the extracted nutrients section. If the report shows Mg as a percentage of CEC rather than ppm, you cannot use this tool directly; convert using your lab’s published method first.
- Potassium (ppm): Ranges widely from 50 ppm in depleted sandy soils to 600+ ppm in high-organic soils. Do not confuse with K2O equivalents sometimes listed on fertilizer bags.
- Sodium (ppm): Often not listed on basic residential soil tests; enter 0 if absent. In irrigated or coastal soils, sodium can be significant and affects sodicity interpretation.
- Exchangeable Acidity (mEq/100g): This is the hydrogen saturation value determined by a buffer pH method. If your report shows only soil pH, you do not have this value; request a buffered acidity analysis from the lab.
- All values must be 0 or greater. The calculator blocks results if any field is empty or negative.
- Units matter: Ppm inputs go into the top four fields; the acidity field uses mEq/100g. Mixing them produces silently wrong results the calculator cannot catch.
Inputs and Outputs (What Each Field Means)
| Field | Unit | What It Measures | Common Entry Mistake | Safe Entry Guidance |
|---|---|---|---|---|
| Calcium (Ca) | ppm | Dominant base cation; primary driver of CEC in most mineral soils; critical for cell wall integrity and root growth | Using the “% base saturation” column from the report instead of the extracted ppm value | Enter the numeric ppm figure from the “Extracted Nutrients” row; verify units say ppm or mg/kg |
| Magnesium (Mg) | ppm | Secondary base cation; required for chlorophyll synthesis; competes with calcium and potassium for CEC sites | Confusing Mg with MgO equivalents listed in some fertilizer conversion tables | Use elemental Mg value in ppm from the soil test; do not apply fertilizer-bag conversion factors |
| Potassium (K) | ppm | Base cation critical for osmotic regulation; leaches easily from low-CEC soils after rainfall events | Entering K2O values (roughly 1.2x elemental K) from a fertilizer specification rather than a soil test result | Confirm the lab report shows elemental K, not K2O or K2SO4 equivalent |
| Sodium (Na) | ppm | Minor base cation in most soils; elevated sodium disperses soil aggregates, destroys structure, and causes sodicity | Leaving this blank when the report actually includes it; understates CEC and misses sodicity risk | Enter 0 only if the lab did not test for Na; otherwise always include the reported value |
| Exchangeable Acidity (H+) | mEq/100g | The hydrogen and aluminum occupying CEC sites; high acidity means fewer sites available for base cations; critical for computing true CEC | Confusing soil pH with exchangeable acidity; pH is a logarithmic index, not a mEq value | Use the buffer acidity or exchangeable acidity figure from a Mehlich or SMP buffer test; if absent, request it from the lab |
| CEC (Output) | mEq/100g | Total cation-holding capacity of the soil; the sum of all cation mEq values including acidity | Treating this as a target to hit with amendments alone; CEC changes slowly and requires organic matter input | Use this value to assess fertilizer schedule frequency, not as a one-time fertilization target |
| Base Saturation % (each cation) | % | The fraction of CEC occupied by each cation; determines nutritional balance and antagonism risk between competing nutrients | Ignoring the acidity saturation percentage and assuming 100% base saturation when acidity is not zero | Review all five saturation outputs together; a high calcium saturation may still mask high acidity if CEC is low |
Worked Examples (Real Numbers)
Example 1: Sandy Loam with Low CEC and Leaching Risk
- Calcium: 800 ppm
- Magnesium: 120 ppm
- Potassium: 150 ppm
- Sodium: 30 ppm
- Exchangeable Acidity: 1.5 mEq/100g
Ca mEq = 800 / 200 = 4.000 | Mg mEq = 120 / 120 = 1.000 | K mEq = 150 / 390 = 0.385 | Na mEq = 30 / 230 = 0.130 | Acidity = 1.500
Result: CEC = 7.01 mEq/100g
This soil falls squarely in the sandy low-CEC zone. Ca saturation is 57.0%, below the Albrecht minimum of 65%, and K saturation is 5.5%, just above the 5% ceiling. A full-season potassium application would exceed holding capacity; split applications of no more than two weeks apart are required. Adding biochar before the next fertilizer cycle is strongly indicated.
Example 2: Loam Soil with Balanced Base Saturation
- Calcium: 1,800 ppm
- Magnesium: 240 ppm
- Potassium: 200 ppm
- Sodium: 50 ppm
- Exchangeable Acidity: 2.0 mEq/100g
Ca mEq = 9.000 | Mg mEq = 2.000 | K mEq = 0.513 | Na mEq = 0.217 | Acidity = 2.000
Result: CEC = 13.73 mEq/100g
A moderate CEC with textbook base saturation: Ca at 65.5%, Mg at 14.6%, and K at 3.7%, all within Albrecht ideal ranges. Standard split fertilizer applications on a 4-week schedule are appropriate. No immediate amendment urgency, though building organic matter toward a CEC of 18 to 20 would improve drought resilience.
Example 3: Clay Loam with High CEC and Elevated Calcium
- Calcium: 3,200 ppm
- Magnesium: 400 ppm
- Potassium: 350 ppm
- Sodium: 80 ppm
- Exchangeable Acidity: 0.5 mEq/100g
Ca mEq = 16.000 | Mg mEq = 3.333 | K mEq = 0.897 | Na mEq = 0.348 | Acidity = 0.500
Result: CEC = 21.08 mEq/100g
Good CEC with strong holding capacity. Ca saturation of 75.9% is at the upper boundary of the Albrecht ideal range; K at 4.3% and Mg at 15.8% are both well-positioned. The low acidity (2.4% saturation) suggests near-neutral or slightly alkaline pH. Micronutrient availability (iron, zinc, manganese) should be monitored at this pH range.
Reference Table (Fast Lookup)
| CEC Range (mEq/100g) | Soil Class | Max Single K Application (lbs/acre, approximation) | Recommended Application Interval | Ca Saturation Target | Priority Amendment |
|---|---|---|---|---|---|
| 0 to 3 | Pure sand / hydroponic substrate | <15 | Weekly or with every irrigation | 65-75% | Biochar + humic acid; build CEC before any nutrient program |
| 3 to 5 | Very sandy soil | 15 to 25 | Every 10 to 14 days | 65-75% | High-rate compost incorporation; slow-release organic fertilizers |
| 5 to 10 | Sandy loam (Leaching Zone) | 25 to 50 | Every 2 to 3 weeks (spoon-feed protocol) | 65-75% | Biochar or humic/fulvic acid; avoid single large K or N applications |
| 10 to 15 | Loam / silt loam | 50 to 80 | Every 4 to 5 weeks | 65-75% | Compost top-dressing; maintain organic matter above 3% |
| 15 to 20 | Clay loam / organic loam | 80 to 120 | Every 6 to 8 weeks | 65-75% | Balanced NPK; monitor micronutrients if pH is rising |
| 20 to 30 | Clay loam to heavy clay | 120 to 180 | Standard seasonal program | 65-75% | Avoid compaction; tillage may be needed to maintain aeration |
| 30 to 40 | Heavy clay | Up to 200 | Seasonal, split into 2 passes | 65-75% | Gypsum if sodium saturation exceeds 5%; watch for waterlogging |
| 40 to 60 | High-organic or muck soil | Not a limiting constraint | Seasonal; oversupply rarely leaches but may lock micronutrients | 65-75% | Monitor Fe, Mn, Zn, B at high pH; phosphorus fixation risk increases |
| Above 60 | Peat / organic substrate | Not a limiting constraint | Formula-based; CEC not the constraint | 65-75% | pH management is the primary lever; CEC is abundant |
How the Calculation Works (Formula + Assumptions)
Show the calculation steps
The calculator follows the standard NRCS milliequivalent method for converting ppm elemental concentrations into exchangeable cation quantities:
- Calcium mEq: Ca (ppm) divided by 200. Calcium has an atomic weight of approximately 40 g/mol and a valence of 2, giving a milliequivalent weight of 20 mg/meq. Dividing by 20 then multiplying by 0.1 (to convert from per-gram to per-100g) simplifies to dividing by 200.
- Magnesium mEq: Mg (ppm) divided by 120. Atomic weight 24, valence 2, meq weight = 12; adjusted for 100g = divide by 120.
- Potassium mEq: K (ppm) divided by 390. Atomic weight 39, valence 1, meq weight = 39; adjusted for 100g = divide by 390.
- Sodium mEq: Na (ppm) divided by 230. Atomic weight 23, valence 1, meq weight = 23; adjusted for 100g = divide by 230.
- Total CEC: Sum of all four cation mEq values plus the exchangeable acidity value (already in mEq/100g, entered directly).
- Base Saturation %: For each cation, divide its mEq by total CEC and multiply by 100. Rounded to one decimal place in outputs.
Rounding rule: CEC is displayed to two decimal places. Base saturation percentages are displayed to one decimal place. Intermediate mEq values are computed in full floating-point precision before rounding for display.
Assumptions and Limits
- Conversion factors (divide by 200, 120, 390, 230) assume standard mineral soil with elemental ppm values from a certified extraction method (Mehlich-3, ammonium acetate, or similar). Results may differ slightly for organic soils or unusual mineralogy.
- Exchangeable acidity is entered directly in mEq/100g as determined by a buffer pH method (SMP, Mehlich buffer, or similar). This value is not derivable from soil pH alone without additional lab data.
- The calculator treats sodium as a base cation and includes it in total CEC, which is standard for most labs. Some older lab report formats exclude sodium from their CEC sum; check whether your lab’s reported CEC matches the sum of all listed cations before comparing results.
- Micronutrients (iron, manganese, zinc, boron, copper) are not included in this CEC calculation, as they occupy trace portions of CEC sites and are typically handled separately in micronutrient soil tests.
- The Albrecht ideal base saturation targets (Ca 65 to 75%, Mg 10 to 20%, K 2 to 5%) are widely cited in university extension literature but represent targets for general agronomic crops, not every plant species or growing system. Some crop systems operate well outside these ranges.
- The “Sandy Leaching Sieve” threshold of 10 mEq/100g is a practical agronomic decision point, not a universally binding chemical law. Soils near the boundary (9 to 11 mEq/100g) may behave differently depending on clay mineralogy and organic matter quality.
- This tool does not account for temporal CEC changes due to organic matter decomposition, wetting and drying cycles, or soil acidification over time.
Standards, Safety Checks, and “Secret Sauce” Warnings
Critical Warnings
- The Sandy Leaching Sieve (CEC below 10): When CEC falls below 10 mEq/100g, the soil’s electromagnetic holding capacity is insufficient for standard fertilizer application rates. A single heavy rainfall event can displace a large fraction of applied potassium and nitrogen into groundwater. The tool enforces a spoon-feeding protocol flag at this threshold. Before investing in a major fertilizer program, the soil leaching requirement calculator can quantify exactly how much of your applied nutrients will pass through the root zone.
- Sodium saturation above 5%: High sodium disperses clay aggregates, collapses soil pore structure, and creates a physical barrier to both water infiltration and root penetration. Sodic conditions are not correctable with organic matter alone; gypsum (CaSO4) is required to displace sodium from CEC sites.
- Exchangeable acidity above 30% of CEC: Strongly acidic soils with this level of hydrogen saturation typically register pH below 5.5. Aluminum toxicity becomes a secondary concern at this point. Crop yields and fertilizer efficiency both drop sharply. Lime applications calibrated by the soil pH lime calculator should be the first priority before any nutrient program is designed.
- Ca:Mg ratio outside the 4:1 to 7:1 range: When magnesium saturation climbs high enough to push the Ca:Mg ratio below 4:1, calcium uptake is suppressed through cation antagonism. Conversely, ratios above 10:1 signal magnesium deficiency. Neither condition is visible in a basic NPK soil test without the full CEC breakdown.
Minimum Standards
- Calcium base saturation should fall between 65% and 75% for most broadacre crops and vegetable production systems (Albrecht standard).
- Potassium base saturation should remain between 2% and 5%. Rates above 5% indicate luxury consumption and potential cation antagonism; below 2% indicates deficiency that will limit yield regardless of CEC.
- Total base saturation (sum of Ca, Mg, K, Na percentages, excluding acidity) should exceed 80% for productive mineral soils. Soils where acidity exceeds 20% of CEC are considered acidic enough to restrict root activity and fertilizer uptake efficiency.
Competitor Trap: Most CEC explainer pages and basic calculators report a single CEC number and stop there. The number by itself tells you almost nothing useful about fertility management. What matters is the composition of that CEC: which cations are occupying those sites, whether they are in correct proportion to each other, and whether the CEC is high enough to justify the fertilizer application schedule you are planning. A CEC of 12 with 72% calcium saturation and 3.5% potassium saturation represents a fundamentally different management situation than a CEC of 12 with 52% calcium, 8% potassium, and 25% acidity, even though the headline number is identical.
Common Mistakes and Fixes
Mistake: Applying a Full-Season Fertilizer Dose to Low-CEC Sandy Soil
The most expensive and environmentally harmful error in soil fertility management is assuming that all soils can hold a standard 6-to-8 week fertilizer application. Soils with CEC below 10 mEq/100g lack the charge sites to retain more than a fraction of the applied nutrients between rain events. A single 1-inch rainfall on a CEC-5 sandy soil can displace the majority of soluble potassium below the root zone within 24 hours.
Fix: For any soil with CEC below 10, switch immediately to a spoon-feeding protocol: small, frequent applications matched to current crop uptake rates and applied just before active growth periods.
Mistake: Treating pH and Exchangeable Acidity as Interchangeable
Soil pH is a logarithmic measurement of hydrogen ion activity in solution at the moment of testing. Exchangeable acidity measures the quantity of hydrogen and aluminum held on CEC sites that will be released over time as the soil buffers against applied amendments. A soil can read pH 6.2 (seemingly acceptable) while still carrying 2.5 mEq/100g of exchangeable acidity, which substantially reduces effective base saturation and predicts poor buffering against further acidification.
Fix: Always request the buffer acidity or exchangeable acidity result from your lab rather than relying solely on pH for lime requirement calculations. The agricultural lime calculator requires the mEq acidity value, not just pH, for accurate lime rate recommendations.
Mistake: Ignoring the Sodium Entry Field
Basic residential soil test packages often do not report sodium, so users habitually enter 0 without checking whether sodium was tested. In irrigated fields, coastal regions, or areas with road salt exposure, sodium can be present at levels that push Na saturation above 5%, triggering sodic conditions that degrade soil structure significantly. An incomplete CEC sum that omits sodium also understates the true holding capacity.
Fix: Explicitly request sodium analysis from the lab before final CEC calculation. If the region has any history of salt water, recycled irrigation water, or heavy road de-icing, assume sodium testing is non-optional.
Mistake: Assuming CEC Is Constant Year to Year
CEC is not a fixed property like particle size distribution. It fluctuates meaningfully with soil organic matter levels, pH shifts, and clay mineral weathering. A CEC result from a soil test conducted two or three years ago under different management may not reflect current conditions. Soil bulk density measurements taken alongside CEC retests help determine whether changes are due to organic matter accumulation or structural compaction, both of which affect nutrient holding behavior differently.
Fix: Re-test CEC every two to three years in actively managed soils, or annually in soils undergoing amendment programs with biochar or compost.
Mistake: Using Fertilizer-Bag Conversion Values Instead of Lab-Reported ppm
Fertilizer labels express nutrients as oxides (K2O, MgO, CaO) for regulatory standardization. These are not the same as elemental values. K2O is approximately 1.2x the elemental potassium content; MgO is approximately 1.66x elemental magnesium. Entering K2O values from a fertilizer label into a field expecting elemental K ppm will overstate potassium mEq by 20%, distorting both CEC and base saturation outputs.
Fix: Use only values from the soil test report’s extracted nutrients or elemental analysis section. Never source input values from fertilizer product specifications.
Next Steps in Your Workflow
Once you have your CEC and base saturation breakdown, the next decision point is whether to address CEC first or adjust nutrient ratios within the existing CEC. Soils below 10 mEq/100g need organic matter and CEC-building amendments (biochar, compost, humic acids) before a nutrient program will hold long enough to matter. Soils between 10 and 20 mEq/100g can usually sustain a productive fertility program but benefit from adjusted application timing and rate-splitting. The full nutrient rate planning step starts with the NPK calculator, which takes your crop’s demand and works backward to application rates per unit area.
For high-sodium soils, the base saturation results here will flag sodicity risk, but quantifying the leaching and gypsum application needed to reclaim the soil requires a different calculation. Soils showing K saturation above 7% alongside elevated sodium may also have fertilizer salt accumulation contributing to root zone stress; the fertilizer salt index calculator can help assess whether applied fertilizer is adding to an already stressed chemical environment.
FAQ
What is a good CEC for garden soil?
For productive vegetable or ornamental garden soil, a CEC of 10 to 25 mEq/100g is generally considered adequate. Below 10, nutrient leaching becomes a practical management problem. Above 25, the soil holds nutrients well but may require additional attention to aeration and drainage. The base saturation percentages within that range matter as much as the total CEC number itself.
Can I improve my soil’s CEC without tilling?
Yes. Surface applications of mature compost, biochar, and humic acid products increase CEC over time as organic matter works into the upper soil profile through biological activity and wetting cycles. Results are slower than with incorporation but meaningful within one to two growing seasons for regularly watered systems. Cover crops with deep taproots also contribute organic material at depth.
Why does the calculator include exchangeable acidity in the CEC sum?
CEC is the total charge capacity of the soil, not just the capacity held by base cations. Hydrogen and aluminum ions occupy CEC sites in acidic soils just as calcium and potassium do. Omitting acidity from the CEC sum would understate the true holding capacity and overstate base saturation percentages, giving an artificially optimistic picture of fertility balance.
How is CEC related to soil texture?
Clay particles and organic matter carry the negative surface charges that constitute CEC. Sandy soils have very little clay surface area and therefore very low CEC; clay soils have high surface area and much higher CEC. Organic matter contributes disproportionately to CEC relative to its mass, which is why building organic matter is one of the most effective ways to raise CEC in light-textured soils over time.
What does it mean if my Ca:Mg ratio is too low?
A Ca:Mg ratio below 4:1 means magnesium is competing strongly for root uptake sites with calcium, potentially suppressing calcium absorption even when calcium saturation appears adequate on paper. The practical symptom is often blossom end rot in fruiting vegetables or soft-tissue symptoms despite high calcium ppm in the soil test. Calcium applications as gypsum or high-calcium lime can rebalance the ratio without dramatically raising pH.
How often should I run a full CEC soil test?
For active agricultural production, a full CEC and base saturation panel every two to three years is typical when management is stable. If you are actively applying compost, biochar, lime, or other amendments to change CEC or pH, annual testing is more appropriate to track response. Sandy low-CEC soils being amended intensively may warrant testing each season during the building phase.
Conclusion
The CEC soil calculator surfaces a decision that most fertility guides skip: whether your soil can physically hold the nutrients you plan to apply before the next rainfall event. A CEC below 10 mEq/100g is not just a number indicating poor soil; it is a hard physical constraint on fertilizer program design. The single biggest mistake is spending on inputs that the soil cannot retain, then attributing poor crop response to the fertilizer source rather than to the soil’s fundamental holding limitation.
If your base saturation results show imbalanced ratios alongside a low or moderate CEC, address the structural soil problem before attempting to correct nutrient ratios. Amendments like biochar and compost change the underlying physics before chemistry adjustments become durable. For soils where pH correction is the first step, the lower soil pH calculator can quantify sulfur amendment rates if acidification rather than liming is the direction indicated by your results.
Lead Data Architect
Umer Hayiat
Founder & Lead Data Architect at TheYieldGrid. I bridge the gap between complex agronomic data and practical growing, transforming verified agricultural science into accessible, mathematically precise tools and guides for serious growers.
View all tools & guides by Umer Hayiat →


