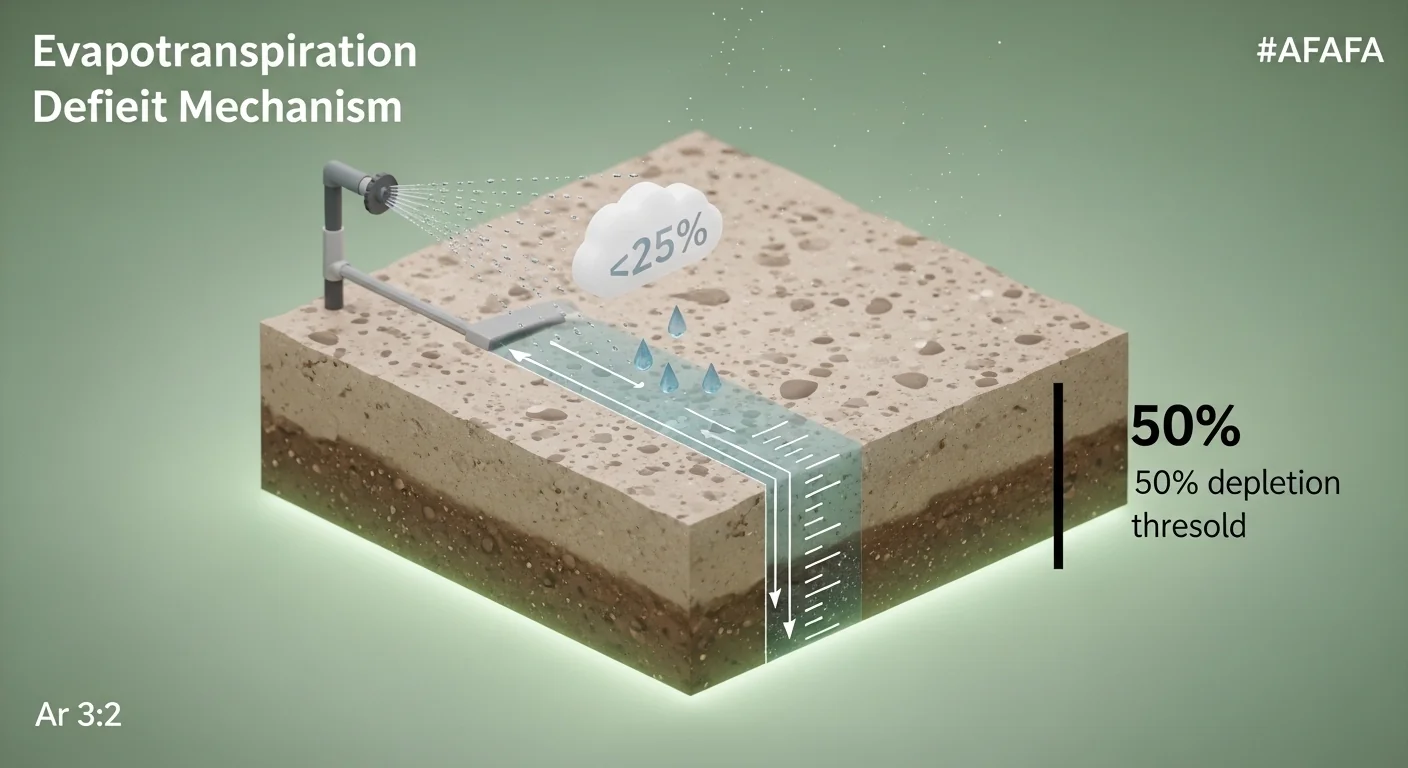
The core problem with most lawn watering advice is that it treats irrigation as a schedule instead of a deficit equation. Evapotranspiration (ET) is the combined rate at which soil evaporates water and grass transpires it through its leaves. When weekly ET exceeds what rainfall delivers, a deficit opens. The only accurate way to answer “how long should I run my sprinklers” is to close that deficit precisely, accounting for your system’s delivery efficiency and the physics of how water moves into a root zone. Fixed-minute timers ignore all of this.
This calculator computes your weekly water deficit by subtracting measured or reported rainfall from your weekly ET rate, then converts that number into a runtime in minutes based on your system’s precipitation rate and efficiency. It does not account for soil type beyond a loam baseline, slope-driven runoff timing, or local municipal watering restrictions. What it does provide is a mathematically derived starting point that replaces guesswork with a repeatable, weekly process grounded in the ET model used by cooperative extension programs across the country.
After entering four measurements and selecting your system type, you will know the exact number of minutes to run your sprinklers this week, along with whether your turf is approaching drought stress or still safely within its root zone water reserve.
Use the Tool
Turfgrass ET Deficit & Deep Watering Calculator
Calculate your lawn’s true water deficit — then schedule the right irrigation runtime
| Weekly ET (in) | Rainfall (in) | Deficit (in) | Target Irr. (in) | Runtime (min) |
|---|
How This Calculator Works
This turf watering calculator uses four inputs to determine how much water your lawn actually needs — and exactly how long to run your sprinklers to deliver it.
If deficit ≤ 0: Your lawn received enough water — skip irrigation this week.
Efficiency corrects for sprinkler losses (wind drift, runoff). A 75% efficient system must apply 1.33× the deficit to actually deliver the target amount to the root zone.
Precipitation Rate (in/hr) is how fast your system delivers water. Divide target by rate, then multiply by 60 to convert hours to minutes.
Used to assess how deeply root-depleted your soil is. Encourages deep, infrequent watering cycles.
Assumptions & Limits:
- ET rates are weekly averages; peak summer ET can reach 2–2.5 in/week in hot climates.
- Soil type assumed to be loam (0.1 in available water per inch of depth). Sandy soils hold less; clay holds more.
- Precipitation rate should be measured with catch cups for best accuracy.
- This tool covers cool-season and warm-season turfgrasses; specific ET values vary by species.
- Efficiency values: Spray heads 55–65%, rotary heads 70–80%, drip 80–90%, smart controllers 85–92%.
- System capacity and run-time limits are not modeled (cycle-soak may be needed for slopes or clay soils).
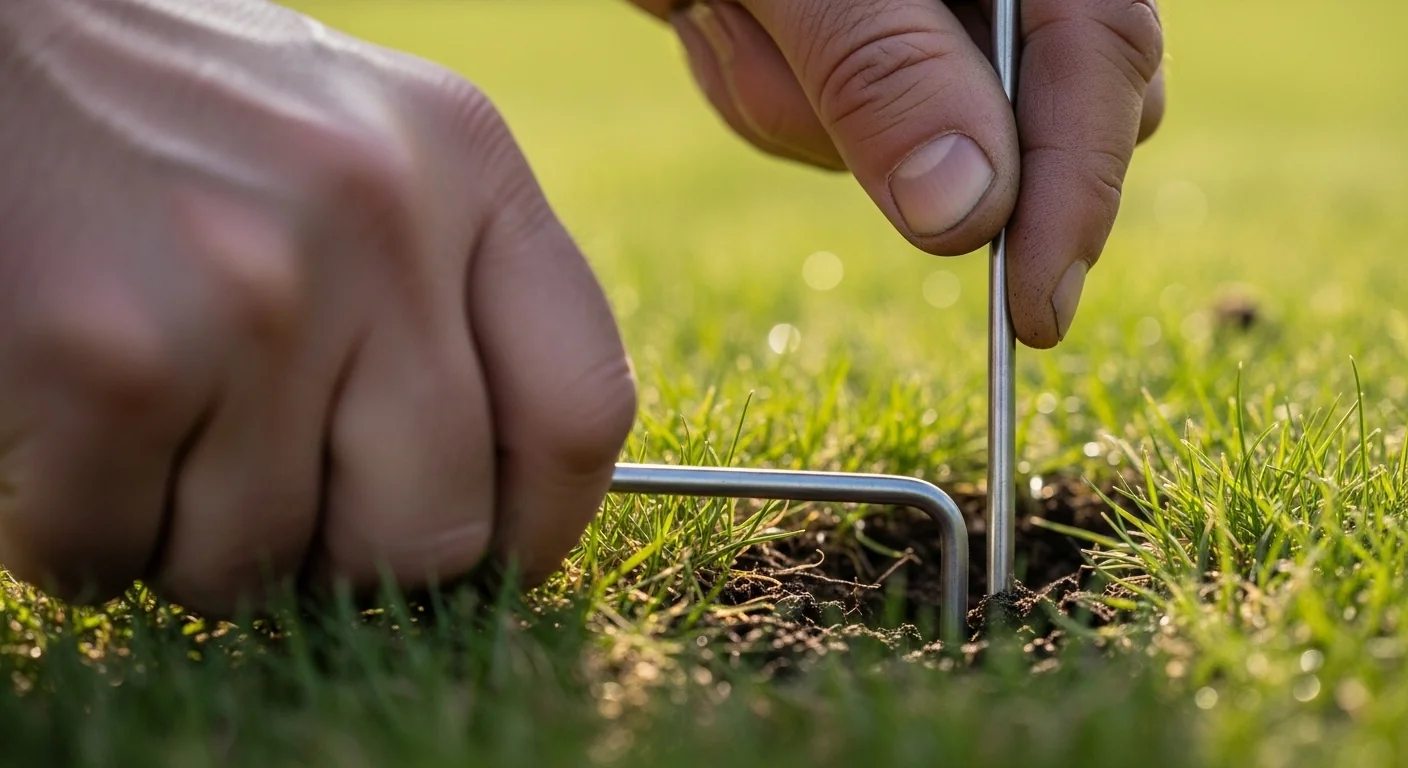
Before entering values, have three pieces of information ready: your local weekly ET rate (available from your state’s cooperative extension service, a personal weather station via Weather Underground or the CoCoRaHS network, or a smart controller like Rachio that calculates it automatically), the total rainfall your lawn received this week measured at ground level, and your irrigation system’s precipitation rate. If you do not have a measured precipitation rate, a catch-cup test using flat-bottomed cans placed across your lawn for a 15-minute test run will give you an in/hr figure to use directly. Root depth can be verified by pushing a soil probe or thin screwdriver into moist soil the morning after watering and noting where resistance begins.
Quick Start (60 Seconds)
- Weekly ET Rate (inches): Pull this from a weather service or extension office for your zip code. Peak summer weeks in hot climates run 1.75 to 2.5 inches. Off-season or overcast weeks may be 0.5 inches or below. Do not use a national average; ET varies sharply by region and week.
- Rainfall This Week (inches): Enter actual measured precipitation, not forecast amounts. A rain gauge at ground level is the only reliable method. Rain from two days ago counts; evaporation since then does not reduce it in this model.
- Sprinkler Precipitation Rate (in/hr): Rotary heads typically deliver 0.3 to 0.7 inches per hour. Fixed spray heads deliver 1.0 to 2.0 inches per hour. Mixing head types in a single zone is the most common cause of overwatering in one area while underwatering another.
- Root Depth (inches): Enter 4 to 8 inches for a healthy lawn. If your grass has been watered daily in short bursts for months, root depth may be 1 to 3 inches. Honest input here is the most important single entry in the form.
- System Efficiency: Select the button that matches your head type. This is not a minor rounding factor. The difference between spray heads at 60% and a smart drip system at 90% changes your required runtime by 50%.
- Unit reminders: All water quantities are in decimal inches, not fractions. Enter 0.25 for a quarter inch, not 1/4. ET and rainfall are weekly totals, not daily averages.
- Common entry mistake: Entering daily ET instead of weekly ET will result in a deficit that is 7 times too small, causing severe underwatering that looks correct on screen.
Inputs and Outputs (What Each Field Means)
| Field | Unit | What It Means | Common Mistake | Safe Entry Guidance |
|---|---|---|---|---|
| Weekly ET Rate | inches/week | The combined weekly water loss from soil evaporation and grass leaf transpiration. Reflects temperature, wind, solar radiation, and humidity. | Using a monthly or seasonal average instead of a current weekly figure. ET spikes dramatically during heat events. | Use the weekly value from your county extension ET network or a personal weather station. Typical range: 0.3 to 2.5 in/wk. |
| Rainfall This Week | inches | Actual precipitation delivered to your lawn surface this week. This is subtracted directly from ET to determine whether a deficit exists. | Relying on a rain gauge at a neighbor’s house or an airport station instead of a on-property measurement. A mile can mean half an inch difference. | Use an on-site tipping bucket or manual rain gauge. Enter 0 if no measurable rain fell, not an estimate. |
| Sprinkler Precipitation Rate | inches/hour | The rate at which your irrigation system delivers water to the turf surface. Dictates how long a zone must run to apply a target depth of water. | Using the manufacturer’s rated PR instead of the actual catch-cup measured rate. Head spacing, pressure variations, and wind reduce real-world PR below spec. | Run a 15-minute catch-cup test across your zone. Multiply average catch by 4 to convert to in/hr. |
| Root Depth | inches | The depth to which your turf grass actively roots. Defines the reservoir size the tool uses to assess drought stress severity. | Assuming 6-inch root depth without measuring, when a history of short daily watering cycles has confined roots to the top 1 to 2 inches. | Probe after irrigation. Roots follow water. Shallow water history means shallow roots; enter what is real. |
| System Efficiency | decimal (60-90%) | The fraction of applied water that actually reaches the root zone versus what is lost to evaporation, wind drift, runoff, and distribution non-uniformity. | Assuming 100% efficiency (no loss). Every real sprinkler system loses some water. | Select the closest match for your head type. When mixing heads in a zone, use the lower efficiency rating. |
| Water Deficit (output) | inches | ET minus rainfall. The net water shortfall your lawn experienced this week. If this is zero or negative, no irrigation is needed. | Irrigating anyway when the deficit is negative, which contributes to fungal disease, shallow roots, and runoff. | Trust a zero or negative deficit. Soil holds moisture between events; supplemental irrigation on wet weeks trains shallow roots. |
| Target Irrigation (output) | inches | The gross amount of water your system must apply to net the required deficit amount, after accounting for system efficiency losses. | Applying only the deficit amount without the efficiency correction, resulting in chronic underwatering even with a seemingly adequate runtime. | This number is always equal to or greater than the deficit. The difference is real loss that your soil never receives. |
| Runtime (output) | minutes | The total sprinkler run time needed this week to close the deficit. Based on target irrigation divided by your precipitation rate, converted from hours to minutes. | Splitting this across seven daily sessions of equal length, which prevents water from percolating below the top inch of soil. | Deliver this runtime in one or two sessions separated by at least 30 minutes to allow surface infiltration and prevent runoff. |
| Recommended Interval (output) | days | An estimated number of days between deep watering sessions, based on ET rate and root zone capacity. Longer is better when roots are deep. | Treating this as a minimum rather than a target. Watering before the interval elapses trains roots toward the surface. | Allow the interval to pass before the next watering cycle. Slight wilt at day’s end before the interval expires is acceptable stress signaling. |
Worked Examples (Real Numbers)
Example 1: Suburban Lawn, Peak Summer Week
- Weekly ET Rate: 1.50 in
- Rainfall: 0.25 in
- Precipitation Rate: 0.50 in/hr (rotary heads)
- Root Depth: 6 in
- System Efficiency: 75% (rotary/mixed)
Result: Deficit = 1.25 in. Target Irrigation = 1.25 / 0.75 = 1.67 in. Runtime = (1.67 / 0.50) x 60 = 200 minutes total.
This is a substantial runtime for a single session. For clay or compacted soils, divide into two 100-minute sessions with a 45-minute soak period between them to allow surface infiltration and prevent runoff. A deep single irrigation session is far preferable to seven daily 28-minute sessions.
Example 2: Wet Week, No Irrigation Required
- Weekly ET Rate: 1.00 in
- Rainfall: 1.20 in
- Precipitation Rate: 0.40 in/hr
- Root Depth: 5 in
- System Efficiency: 75%
Result: Deficit = 1.00 – 1.20 = -0.20 in. No irrigation required.
The soil received more water than the turf lost to ET this week. Watering anyway risks root oxygen depletion, promotes fungal disease, and contributes to surface runoff that carries fertilizer into storm drains. Skip this week entirely and recheck ET and rainfall at the same time next week.
Example 3: High ET Week, Fixed Spray Heads
- Weekly ET Rate: 2.00 in
- Rainfall: 0.00 in
- Precipitation Rate: 1.50 in/hr (spray heads)
- Root Depth: 4 in
- System Efficiency: 60% (spray heads)
Result: Deficit = 2.00 in. Target Irrigation = 2.00 / 0.60 = 3.33 in. Runtime = (3.33 / 1.50) x 60 = 133 minutes total.
At 1.50 in/hr, spray heads are applying water faster than most loam soils can absorb it (typical infiltration rate: 0.5 to 1.0 in/hr for loam). A cycle-and-soak approach, with 3 sessions of 44 minutes each separated by 30-minute intervals, will reduce puddling and runoff while delivering the full target depth into the root zone.
Reference Table (Fast Lookup)
Values below assume a loam soil, rotary head system at 0.50 in/hr precipitation rate and 75% efficiency, with a 6-inch root zone depth.
| Weekly ET (in) | Rainfall (in) | Deficit (in) | Target Irrigation (in) | Runtime at 0.50 in/hr (min) | Runtime at 1.50 in/hr (min) |
|---|---|---|---|---|---|
| 0.50 | 0.00 | 0.50 | 0.67 | 80 | 27 |
| 0.50 | 0.50 | 0.00 | 0.00 | 0 (skip) | 0 (skip) |
| 1.00 | 0.00 | 1.00 | 1.33 | 160 | 53 |
| 1.00 | 0.50 | 0.50 | 0.67 | 80 | 27 |
| 1.50 | 0.25 | 1.25 | 1.67 | 200 | 67 |
| 1.50 | 1.00 | 0.50 | 0.67 | 80 | 27 |
| 2.00 | 0.50 | 1.50 | 2.00 | 240 | 80 |
| 2.00 | 1.00 | 1.00 | 1.33 | 160 | 53 |
| 2.50 | 0.00 | 2.50 | 3.33 | 400 | 133 |
| 2.50 | 1.00 | 1.50 | 2.00 | 240 | 80 |
Runtimes above 120 minutes at a 0.50 in/hr rate indicate high ET conditions where cycle-and-soak scheduling is strongly recommended regardless of soil type. For spray heads at 1.50 in/hr, any runtime above 40 minutes per session warrants splitting into two applications.
How the Calculation Works (Formula + Assumptions)

Show the calculation steps
Step 1: Water Deficit
Water Deficit (in) = Weekly ET Rate (in) – Rainfall (in)
If the result is zero or negative, the deficit is set to zero and no irrigation is recommended. Negative deficits do not carry over to the following week in this model.
Step 2: Target Irrigation
Target Irrigation (in) = Water Deficit (in) / System Efficiency (decimal)
System efficiency is expressed as a decimal between 0 and 1 (for example, 75% becomes 0.75). Dividing by a number less than 1 always produces a target larger than the raw deficit, which is the correct direction. Your system must over-apply water at the surface to net the required amount at root depth.
Step 3: Runtime
Runtime (minutes) = (Target Irrigation (in) / Precipitation Rate (in/hr)) x 60
Dividing target irrigation by the precipitation rate yields hours of runtime. Multiplying by 60 converts to minutes. The result is rounded to the nearest whole minute in the display.
Step 4: Drought Stress Assessment
Root Zone Water Capacity (in) = Root Depth (in) x 0.10
This assumes a loam soil with approximately 0.10 inches of available water per inch of soil depth, a commonly used agronomic baseline. The tool compares the deficit to this capacity to determine whether the root zone is below 50% (safe), between 50% and 70% (stress), or above 70% (critical).
Rounding Rules
Deficit and target irrigation values display to two decimal places. Runtime displays to the nearest whole minute. Internal calculations use full floating-point precision before rounding for display.
Assumptions and Limits
- Soil type is assumed to be loam with an available water holding capacity of 0.10 in per inch of depth. Sandy soils hold roughly 0.06 to 0.08 in per inch; clay loam holds 0.15 to 0.18 in per inch. Adjust your root depth interpretation accordingly.
- The model assumes rainfall is uniformly distributed across the turf area. Micro-topography, tree canopy interception, and compaction zones can create dry pockets that receive far less than the measured total.
- Precipitation rate is assumed uniform across the zone. Mixed head types in a single zone will create zones that receive widely different amounts per hour, making a single runtime inadequate for even coverage.
- ET rate is entered as a weekly total. The calculator does not account for day-to-day ET variation within the week. A week with five sunny days and two overcast days may have the same total ET as a week with uniform moderate demand, but the distribution differs.
- System efficiency is treated as a fixed constant for the session, not a variable function of wind speed, pressure fluctuation, or temperature during the irrigation event. Morning irrigation significantly improves real-world efficiency over midday application.
- The recommended watering interval is an estimate based on ET rate and root zone capacity. Actual soil moisture depletion curves are non-linear and depend on plant canopy, microclimate, and solar radiation that the model does not capture.
- The tool does not model mandatory watering day restrictions, municipal supply pressure variations, or backflow preventer pressure loss, all of which affect delivered volume per runtime.
Standards, Safety Checks, and “Secret Sauce” Warnings
Critical Warnings
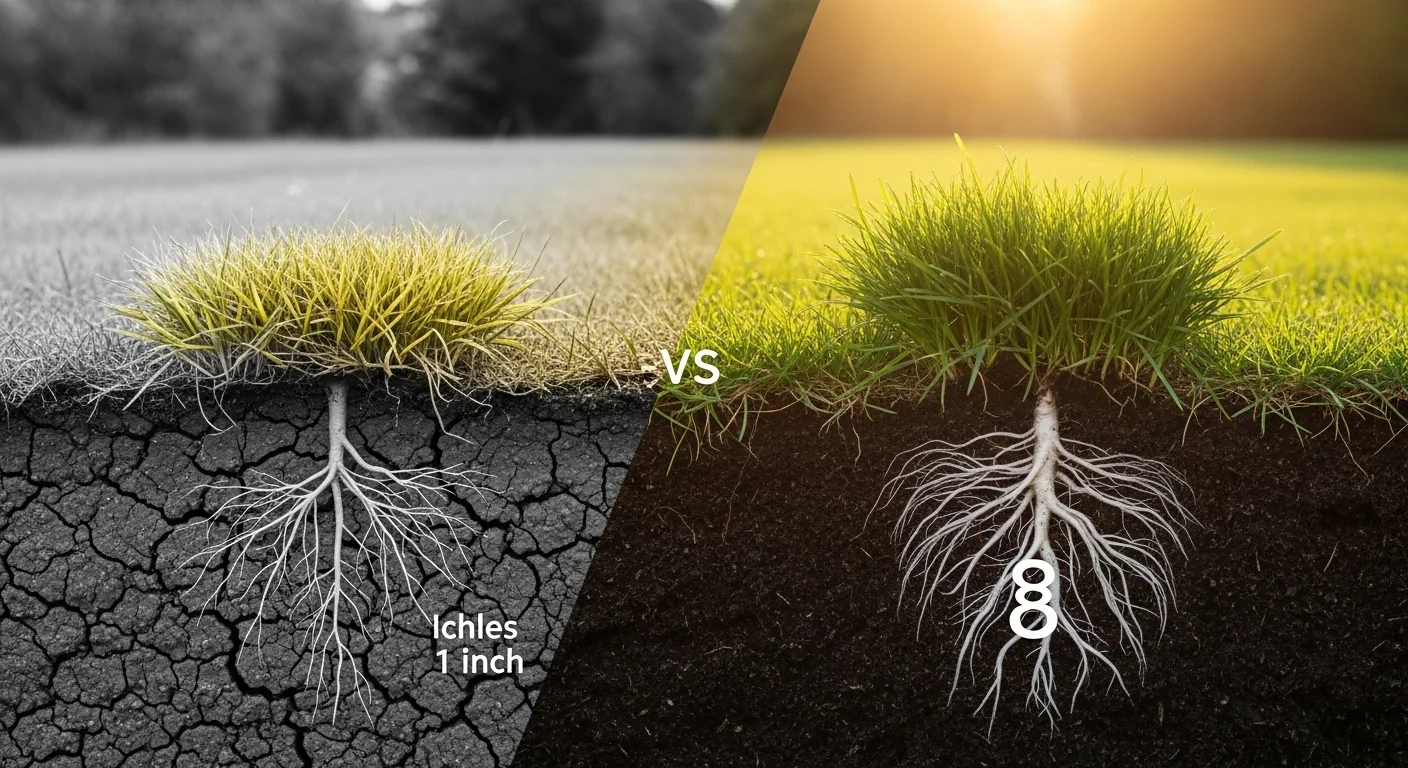
- The “Daily Spritz” Root Biology Trap: Running sprinklers for 10 minutes every day wets only the top 1 inch of soil. Grass roots grow where water is available. After weeks of daily short cycles, your turf develops a root system entirely confined to that top inch. When a heat event pushes air temperatures above 95 degrees Fahrenheit, that top inch of soil bakes dry within 2 to 3 hours of sunrise. The entire lawn loses its only water access simultaneously, and recovery can require full reseeding. This calculator prevents that pattern by computing the full weekly deficit and delivering it in full-depth sessions instead of surface-level spritzs.
- Efficiency Omission Leads to Chronic Underwatering: Entering only the raw deficit without dividing by system efficiency means you are applying less water than the turf needs even when the timer appears adequate. A 75% efficient system running 100 minutes delivers what 75 minutes of perfect application would produce. The other 25 minutes’ worth of water is lost to drift, evaporation, and distribution non-uniformity before it reaches root depth.
- High-PR Spray Heads Exceed Soil Infiltration Rates: Fixed spray heads applying water at 1.5 in/hr or above routinely exceed the 0.5 to 1.0 in/hr infiltration capacity of most loam soils. The excess runs off the surface, often carrying fertilizer or pre-emergent herbicide with it. The tool flags this condition and recommends a cycle-and-soak approach whenever precipitation rate exceeds 1.5 in/hr.
- Irrigation on Negative Deficit Weeks Trains Shallow Roots: Applying supplemental water during weeks when rainfall already met ET demand prevents the soil’s natural drying cycle. That drying cycle is what signals grass roots to grow deeper in search of moisture. Eliminating it produces a lawn that is perpetually wet at the surface, root-shallow, and acutely vulnerable to any heat stress or supply interruption.
Minimum Standards
- Water to the 50% root zone depletion threshold, not before. Allowing the soil to dry to half its available capacity before irrigating is the agronomic standard for turfgrass water management and the single most effective way to train deep root systems.
- Deliver irrigation in a maximum of two sessions per week, with each session targeting the entire weekly target depth or half of it. For those managing artificial turf installations, drainage capacity rather than ET governs water management, but the principle of infrequent, deep application still holds for surrounding natural areas.
- Water in the early morning window (4 AM to 7 AM). Leaf wetness duration during daylight hours is the primary factor in fungal disease pressure; evaporative loss during afternoon watering reduces effective delivery by an estimated significant margin compared to morning application.
Competitor Trap
Most static lawn watering guides publish a “water 1 inch per week” rule as though that value is constant. It is not. Actual turfgrass ET demand varies by a factor of 4 or more across the growing season, with peak summer weeks in hot climates demanding 2 to 2.5 inches per week and spring or fall weeks in moderate climates requiring less than 0.75 inches. Following a fixed weekly target in July delivers the right amount in May and dangerously underperforms when heat demand is highest. The only correct answer is to recalculate weekly against current ET data, which is what this tool is designed to support.
Core aeration is one of the most effective ways to improve the infiltration rate of compacted turf, directly reducing runoff risk during high-PR irrigation events. The lawn aeration calculator can help you determine the correct hole density for your target coverage before your next aeration pass.
If your lawn has significant bare patches from heat stress or shallow-root die-off, timing your reseeding window alongside your irrigation recovery plan matters. The grass seed calculator helps size your seeding rate based on area and species before you begin recovery irrigation.
Common Mistakes and Fixes
Mistake: Using a Weather App Rainfall Figure Instead of a Ground-Level Gauge
Weather station and app rainfall totals represent measurements taken at the reporting station, which can be miles away and experience entirely different precipitation amounts than your property. A storm cell that drops 0.8 inches at the airport may deliver 0.2 inches to a neighborhood 4 miles east, or vice versa. Entering the reported figure instead of a measured one can produce a deficit calculation that is off by more than half an inch, leading to either missed irrigation or overwatering.
Fix: Install an inexpensive tipping-bucket rain gauge on your property and record weekly totals before entering them into this or any ET-based calculator.
Mistake: Setting Runtime Based on “What Looks Wet”
Surface saturation, puddling, or a glistening appearance on the grass blade does not indicate that water has reached the root zone. Spray heads can saturate the top quarter inch of soil and create visible surface moisture while leaving everything below completely dry, particularly in compacted or clay-heavy soils. Homeowners who “water until it looks wet” routinely deliver less than a tenth of the water their turf actually needs.
Fix: Use a soil probe, a long screwdriver, or a moisture meter 30 minutes after irrigation to verify penetration depth. The probe should meet little resistance to the full root depth target.
Mistake: Entering a Manufacturer-Rated Precipitation Rate Instead of a Measured One
Manufacturers rate precipitation at optimal pressure, perfect head spacing, and ideal conditions. Real-world installations with pressure variability, worn nozzles, wind exposure, and non-standard spacing consistently deliver less than the rated figure. Using an inflated PR value makes your calculated runtime shorter than it should be, systematically underwatering your turf every cycle without any visible feedback.
Fix: Conduct a catch-cup test with 4 to 6 flat cans placed at equal spacing across one zone. Run the zone for exactly 15 minutes, average the collected amounts, and multiply by 4 to get actual in/hr.
Mistake: Dividing One Weekly Runtime Into Daily Increments
This is the “Daily Spritz” failure mode quantified. A 160-minute weekly runtime divided into 7 daily sessions produces 23 minutes per day. At 0.50 in/hr precipitation rate, 23 minutes delivers 0.19 inches per day, which wets roughly the top 1.5 to 2 inches of soil at best. Grass roots grow where water is available. After weeks of this pattern, the root zone migrates entirely to the surface layer. A single day of system failure or heat stress then causes immediate wilt or die-off because there is no deeper reserve to draw from.
Fix: Schedule the full weekly runtime in one or two sessions, separated by a soak interval if needed for infiltration, and skip watering on all other days regardless of visual cues.
Mistake: Applying the Same Runtime Year-Round
A runtime calibrated during a 90-degree July heat wave is 2 to 4 times what the same turf needs during a mild October week. Continuing that schedule through the fall keeps soil perpetually saturated, promotes root rot and fungal growth, and wastes water during months when rainfall often meets or exceeds ET demand without supplemental irrigation. Many irrigation controllers are programmed once and never adjusted seasonally, creating this pattern by default.
Fix: Recalculate using this tool weekly during peak season and monthly during shoulder seasons. Alternatively, a weather-linked ET controller automates this adjustment by pulling real-time evaporation data.
Next Steps in Your Workflow
Once your runtime is calculated, the immediate next task is scheduling the session correctly. Morning delivery, ideally starting between 4 AM and 6 AM, minimizes leaf wetness duration and reduces the evaporative loss that cuts into your effective delivery. If your total runtime exceeds what a single continuous session can achieve without causing runoff on your soil type, break it into two equal sessions scheduled 30 to 45 minutes apart on the same morning. After irrigating, probe the soil at the edge of your root zone target depth. If resistance disappears at the expected depth, your precipitation rate and runtime figures are accurate. If the soil is still firm below 3 inches after a 160-minute session, your actual PR is higher than entered and you need to re-run the catch-cup test.
Your lawn care calendar does not stop at watering. Mowing frequency directly affects ET rate because taller grass creates shade at the soil surface and reduces heat load, while scalped grass increases soil temperature and water loss simultaneously. After calibrating your irrigation schedule, the mowing time calculator helps you plan mowing windows efficiently so mowing and irrigation events do not conflict. For those managing turf health through fertilization, understanding nitrogen return from clippings matters for nutrient budgeting. The grass clippings nitrogen calculator quantifies how much fertilizer a mulch-mowing program returns to your turf, which directly informs how much supplemental fertilizer your ET-optimized lawn actually requires.
FAQ
What is a good weekly ET rate for my lawn?
Weekly ET rates depend heavily on your climate zone, current weather, and time of year. Cool-season regions in moderate summer conditions see weekly ET of 0.75 to 1.25 inches. Hot, arid climates during peak summer can push 2.0 to 2.5 inches per week. Contact your county cooperative extension office or access a state ET monitoring network for your specific location and current reading.
How do I find my sprinkler system’s precipitation rate?
The most accurate method is a catch-cup test. Place 4 to 6 flat-bottomed containers at equal intervals across one zone and run that zone for 15 minutes. Average the collected depths, then multiply by 4 to convert to an in/hr figure. Manufacturer spec sheets provide a starting point, but real-world rates typically run 10 to 20 percent below rated values due to pressure variation and head wear.
Why does my calculator recommend such a long runtime?
Long runtimes are the mathematically correct answer when your precipitation rate is low, your deficit is large, or your system efficiency is below average. A rotary head system at 0.40 in/hr delivering 1.5 inches of target irrigation requires 225 minutes. This is not an error. Breaking that runtime into two sessions with a soak interval between them is preferable to reducing it and chronically underwatering your turf.
Should I water if rainfall came close to my ET rate?
If rainfall meets or exceeds your weekly ET, this calculator will produce a zero or negative deficit and recommend skipping irrigation entirely. A small shortfall of 0.10 to 0.15 inches can reasonably be left for the soil moisture buffer to cover, particularly in cooler conditions. Only when the deficit clearly exceeds zero does supplemental irrigation add meaningful value to your root zone water balance.
What does “system efficiency” actually account for?
System efficiency captures all mechanisms by which applied water fails to reach the root zone. This includes wind drift off spray heads, evaporation during the application event, surface runoff from compacted or sloped areas, and distribution non-uniformity where some areas receive more and others less than the target depth. Real sprinkler systems are never 100% efficient. Fixed spray heads in exposed areas can drop below 55% efficiency on windy days.
How often should I recalculate my irrigation needs?
Weekly recalculation during the active growing season is the appropriate interval for ET-based irrigation management. ET demand changes significantly with temperature, cloud cover, humidity, and wind, all of which shift week to week. Running the same schedule for weeks at a time without updating your ET and rainfall inputs is essentially the same as ignoring current conditions entirely.
Conclusion
Evapotranspiration-based irrigation is not a complicated concept, but it requires replacing fixed habits with a weekly measurement practice. The deficit equation is deterministic: whatever water your turf lost through ET and did not receive from rainfall must be replaced at root depth, divided by your system’s real-world efficiency, and delivered in a runtime long enough to percolate through the full root zone. Following that process consistently is what separates a lawn that survives a summer heat event from one that requires complete reseeding in September.
The single most consequential mistake is delivering water in short daily sessions that satisfy the appearance of irrigation while confining root systems to the top inch of soil. Every calculation this tool generates is structured to prevent that pattern by treating water as a weekly deficit to close, not a daily ritual to perform. For homeowners planning to establish or renovate turf from bare soil, the timing and depth of pre-germination irrigation follows the same physics covered here. The sod calculator pairs well with this tool when you are planning a new installation, as matching your target irrigation schedule to your sod type’s establishment water requirements is the most reliable way to achieve full root integration in the first growing season.
Lead Data Architect
Umer Hayiat
Founder & Lead Data Architect at TheYieldGrid. I bridge the gap between complex agronomic data and practical growing, transforming verified agricultural science into accessible, mathematically precise tools and guides for serious growers.
View all tools & guides by Umer Hayiat →


