Evaporation is not a background nuisance — it is a thermodynamic process that operates at a measurable, predictable rate every hour your water feature is exposed to heat, wind, and dry air. A shallow 200-square-foot fountain in July does not just “lose some water.” Under the right conditions, it can lose 40 or more gallons per day strictly to atmospheric evaporation, before accounting for splash and spray. That rate does not slow down on weekends. It does not pause while you are at work. If the pump intake drops below the water surface, the motor runs hot and fails.
This pond evaporation calculator estimates daily water loss in gallons based on your water feature’s surface area, ambient temperature, wind speed, and relative humidity. It also outputs the minimum continuous auto-fill flow rate in gallons per minute (GPM) that would be required to keep the water level stable around the clock. What it does not do: account for splash loss from active spray heads, rainfall contributions, water depth changes, or evaporation from vertical surfaces like waterfall streams. The results reflect open-surface thermodynamic evaporation only.
After running your numbers, you will know whether manual top-offs are physically feasible or whether an auto-fill float valve is a mechanical necessity — not a luxury upgrade. If you have not yet confirmed your pond’s dimensions, working through a pond liner size calculator first will give you the surface area figure you need before entering data here.
Use the Tool
Pond & Fountain Evaporation Calculator
Auto-Fill Sizer & Water Loss Estimator
| Metric | Value |
|---|
Quick Reference: Evaporation by Temperature
| Temp (°F) | Base Rate (in/day) | 200 sq ft Loss (gal) | Auto-Fill (GPM) |
|---|
How This Calculator Works
Step 1 — Base Evaporation Rate: We estimate a base evaporation rate in inches per day from temperature. A simplified thermodynamic model is used: baseRate = 0.00002 × (Temp°F)² − 0.0004 × Temp°F + 0.04. This produces rates from ~0.05 in/day at 60°F to ~0.25 in/day at 110°F.
Step 2 — Humidity Adjustment: Higher humidity reduces evaporation. We scale the rate by (1 − Humidity% / 100). At 0% humidity the full rate applies; at 100% evaporation is zero.
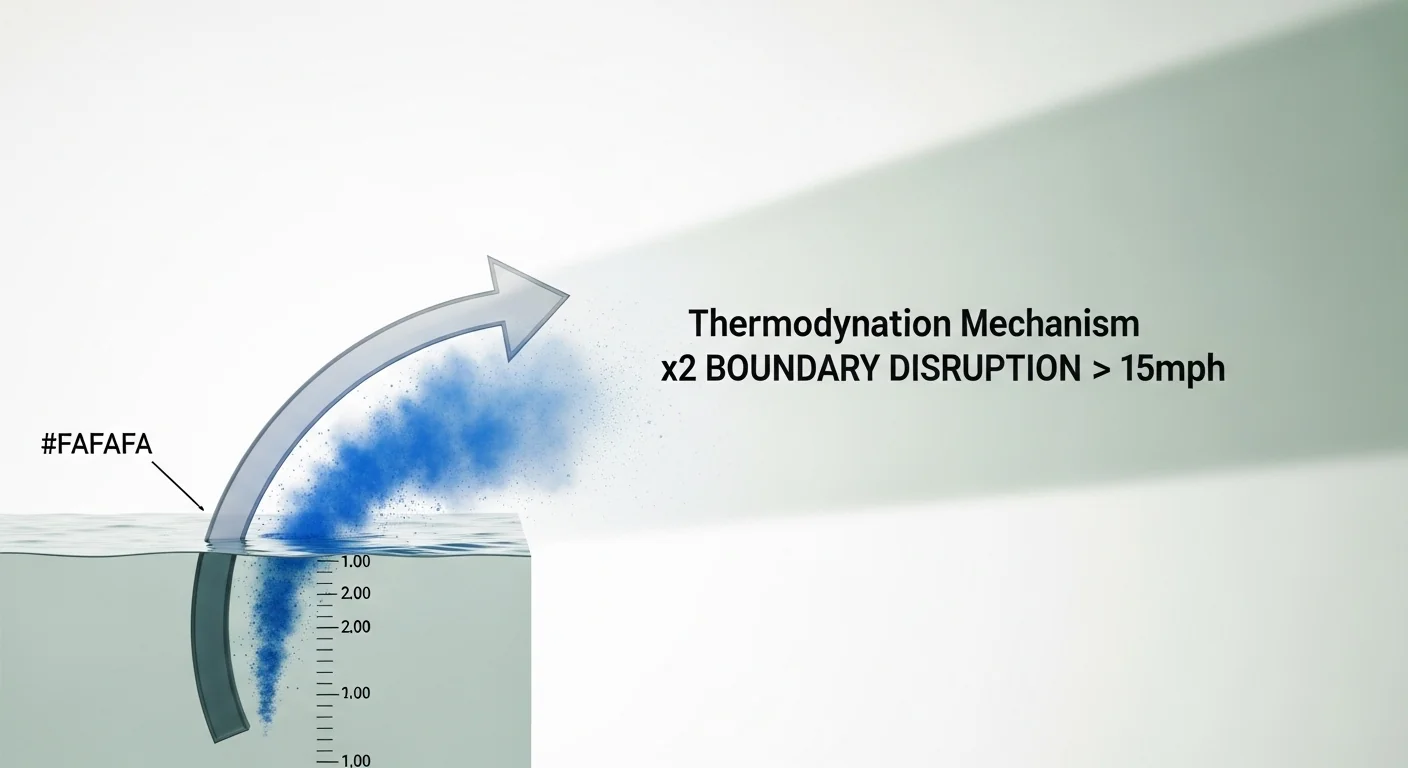
Step 3 — Wind Adjustment: Wind increases evaporation. For wind ≤ 15 mph, we apply 1 + (WindSpeed × 0.04). For wind > 15 mph, the evaporation rate doubles (turbulent boundary-layer disruption).
Step 4 — Gallons Lost Per Day: GallonsLost = Area(sq ft) × (EvapRate ÷ 12) × 7.48. We convert inches of evaporation over the surface area to cubic feet, then to gallons (1 cu ft = 7.48 gal).
Step 5 — Auto-Fill Flow Rate: GPM = GallonsLost ÷ (24 × 60). This is the minimum continuous flow rate in gallons per minute needed to keep the water level stable.
Assumptions: Open-air, still water surface (no waterfall splash loss). Actual losses may be 10–30% higher with fountains, waterfalls, or splash features. Does not account for rainfall replenishment.
Assumptions & Limits
This calculator models thermodynamic evaporation from an open, still water surface. It does not account for splash loss from fountains or waterfalls, rainwater replenishment, shading, or water depth effects.
Wind effects above 15 mph use a simplified doubling factor based on boundary-layer disruption studies. Real-world conditions vary with exposure, fetch distance, and turbulence.
Temperature range: 40–120°F. Humidity range: 0–100%. Surface area: 1–100,000 sq ft. Results are daily estimates and may vary ±15% based on microclimate conditions.
For fountains with active spray heads, add 15–30% to the calculated evaporation loss to account for aerosolized water droplets.
Before calculating, have four numbers ready: the water surface area in square feet (length times width for rectangular features; pi times radius squared for circular ones), your region's average daily high temperature in degrees Fahrenheit for the target season, the typical daytime wind speed in miles per hour at your site, and the average relative humidity as a percentage. For a related pond sizing workflow, the pond liner calculator can help you confirm your total surface dimensions if you are working from a liner spec sheet rather than a measured area.
Quick Start (60 Seconds)
- Water Surface Area: Measure the exposed water surface only -- not the total lot footprint. A 20-by-10-foot pond has a 200 sq ft surface. Do not include underwater shelf area or bog zones below the water line.
- Temperature: Use your average daily high, not the overnight low and not an all-day average. Evaporation accelerates during peak heat hours and that daytime peak drives the daily total.
- Wind Speed: 15 mph is the critical threshold. Above that speed, the calculator applies a doubling factor for boundary-layer disruption. Coastal sites and open hilltop placements commonly exceed 15 mph in the afternoon.
- Humidity: Lower humidity means faster evaporation. A pond in Tucson at 15% humidity and a pond in Tampa at 75% humidity -- same size, same temperature -- behave like two completely different systems.
- Run the calc for your worst month, not your average: Size your auto-fill valve for peak-season demand, not the annual mean. A valve that handles July will handle April easily.
- Check the traffic light: The red/yellow/green indicator tells you whether manual refilling is a viable strategy or whether your feature is in the "burnt pump" risk zone.
- Note the GPM output: Your auto-fill float valve's supply line and float assembly must be capable of delivering at least this flow rate. Match the valve spec to the number, not to a generic "standard" fitting.
Inputs and Outputs (What Each Field Means)
| Field | Unit | What It Represents | Common Mistake | Safe Entry Guidance |
|---|---|---|---|---|
| Water Surface Area | sq ft | Total horizontal area of the exposed water surface. This is the primary evaporation driver -- the bigger the surface, the more gallons lost per inch of depth change. | Measuring the outer pond edge or liner area rather than the actual water surface | For irregular shapes, divide into rectangles and sum them. Acceptable range: 1 to 100,000 sq ft. |
| Avg Daily High Temperature | °F | Typical peak daytime air temperature for the month or season you are sizing for. Higher temperatures increase the vapor pressure deficit and accelerate surface evaporation. | Using average temperature rather than the daytime high, which underestimates peak-hour losses | Use historical climate data for your ZIP code for the hottest month you operate the feature. Range: 40 to 120°F. |
| Average Wind Speed | mph | Typical daytime wind speed at the site. Wind disrupts the humid boundary layer directly above the water surface, replacing saturated air with drier ambient air and accelerating evaporation dramatically above 15 mph. | Entering calm-day wind speeds for a site that regularly experiences afternoon gusts above 15 mph | Check local weather station data or a simple anemometer reading at your site. Range: 0 to 60 mph. |
| Relative Humidity | % | The ambient moisture content of the air as a fraction of saturation. At 100% humidity, the air can absorb no additional water vapor and evaporation effectively stops. At very low humidity, the vapor pressure deficit is large and water leaves the surface rapidly. | Using indoor humidity readings or weather app values that do not reflect the microclimate at the water surface | Use outdoor measurements from a weather station or hygrometer placed near the feature. Range: 0 to 100. |
| Daily Water Loss (output) | gallons/day | Total volume of water lost to atmospheric evaporation in a 24-hour period under the specified conditions. | Treating this as a fixed number that applies year-round rather than a seasonal peak figure | Run the calculator separately for your hottest and mildest months to understand your seasonal range. |
| Evaporation Rate (output) | inches/day | The depth of water lost per day across the entire surface, expressed in linear inches. Useful for comparing to rainfall replenishment data (also expressed in inches). | Confusing this with pool evaporation rate charts, which use different base assumptions | A useful sanity check: a rate above 0.3 in/day is very high and indicates extreme conditions. |
| Auto-Fill Flow Rate (output) | GPM | Minimum continuous flow rate required to fully replace evaporation losses over 24 hours. This is the sizing benchmark for a float-valve auto-fill system. | Choosing an auto-fill valve rated in gallons per hour without converting to confirm the GPM spec matches | Most residential brass float valves handle 0.5 to 3 GPM on a standard 1/2-inch supply line. Verify your supply pressure and valve rating against this number. |
Worked Examples (Real Numbers)
Example 1: Small Backyard Fountain, Mild Summer Conditions
- Surface Area: 50 sq ft
- Temperature: 80°F
- Wind Speed: 5 mph
- Relative Humidity: 50%
Result: Evaporation rate 0.0816 in/day; daily water loss approximately 2.5 gallons; auto-fill rate 0.0018 GPM.
At this scale and in these conditions, a 5-minute hose fill every two to three days is physically adequate. An auto-fill valve is a convenience item, not a mechanical necessity. A standard 1/4-inch trickle valve on city pressure handles this with ease.
Example 2: Medium Koi Pond, Hot Dry Summer Day
- Surface Area: 200 sq ft
- Temperature: 95°F
- Wind Speed: 10 mph
- Relative Humidity: 30%
Result: Evaporation rate 0.1789 in/day; daily water loss approximately 22.3 gallons; auto-fill rate 0.0155 GPM (22.3 gallons per 24-hour period).
This feature loses 156 gallons in a week. A single garden hose session delivering 50 to 75 gallons falls roughly two days short of full replenishment. Without a float-valve system or at minimum a twice-weekly fill routine, the pump intake will intermittently run dry during the second half of the week, shortening motor life significantly.
Example 3: Large Commercial Reflecting Pool, High-Wind Arid Climate
- Surface Area: 500 sq ft
- Temperature: 100°F
- Wind Speed: 20 mph (above 15 mph threshold -- evaporation doubles)
- Relative Humidity: 15%
Result: Evaporation rate 0.340 in/day; daily water loss approximately 106 gallons; auto-fill rate 0.074 GPM.
At 106 gallons lost per day, this feature requires a dedicated auto-fill circuit on a 3/4-inch supply line minimum. A standard 1/2-inch residential float valve at typical city pressure maxes out around 2 to 3 GPM, which is sufficient for the volume, but the supply line pressure drop over distance must also be verified. A site this size also loses over 3,100 gallons per month -- a material water-cost line item in arid municipalities with tiered pricing.
Reference Table (Fast Lookup)
All rows calculated using a 200 sq ft water surface. The "Risk Level" column is derived from the same traffic-light thresholds used in the calculator (red = daily loss exceeds 15% of a nominal 200-gallon reference tank; yellow = exceeds 5%).
| Temp (°F) | Humidity (%) | Wind (mph) | Evap Rate (in/day) | Gallons Lost/Day (200 sq ft) | Auto-Fill (GPM) | Risk Level |
|---|---|---|---|---|---|---|
| 75 | 60 | 5 | 0.059 | 7.3 | 0.0051 | Low |
| 80 | 50 | 8 | 0.090 | 11.2 | 0.0078 | Low |
| 85 | 45 | 10 | 0.116 | 14.4 | 0.0100 | Moderate |
| 90 | 40 | 10 | 0.139 | 17.4 | 0.0121 | Moderate |
| 95 | 30 | 10 | 0.179 | 22.3 | 0.0155 | Moderate |
| 100 | 25 | 12 | 0.222 | 27.7 | 0.0192 | High |
| 100 | 20 | 20 | 0.320 | 39.9 | 0.0277 | Critical |
| 105 | 15 | 15 | 0.297 | 37.0 | 0.0257 | Critical |
| 110 | 10 | 20 | 0.428 | 53.4 | 0.0371 | Critical |
How the Calculation Works (Formula + Assumptions)

Show the calculation steps
Step 1 -- Base Evaporation Rate: A temperature-driven base rate is calculated in inches per day using a quadratic relationship: base rate = (0.00002 × T²) minus (0.0004 × T) plus 0.04, where T is temperature in °F. This approximates the vapor pressure increase with temperature and produces rates from roughly 0.04 in/day at 40°F to 0.24 in/day at 110°F.
Step 2 -- Humidity Scaling: The base rate is multiplied by (1 minus H / 100), where H is relative humidity in percent. At 100% humidity the output is zero; at 0% humidity the full base rate applies. This represents the vapor pressure deficit -- the driving force that pulls water molecules off the surface.
Step 3 -- Wind Factor: For wind speeds at or below 15 mph, the rate is multiplied by (1 + wind speed × 0.04). For wind speeds above 15 mph, the entire adjusted rate is doubled, reflecting turbulent boundary-layer disruption that continuously replaces the saturated air layer above the water surface with dry ambient air. The 15 mph threshold is the critical split point derived from standard evaporation modeling for open water surfaces.
Step 4 -- Gallons Lost per Day: gallons = surface area (sq ft) × (evaporation rate / 12) × 7.48. Dividing by 12 converts inches to feet; multiplying by 7.48 converts cubic feet to US gallons.
Step 5 -- Auto-Fill GPM: Required GPM = gallons lost / (24 × 60). This gives the minimum continuous flow rate in gallons per minute that would keep the level perfectly stable over a full day.
Rounding: Gallons are displayed to one decimal place. GPM is displayed to four decimal places due to the small magnitudes involved in residential-scale features.
Assumptions and Limits
- Results model open, still-water surface evaporation only. Active spray fountains, waterfalls, and bubblers introduce additional loss (typically 15 to 30% more) through aerosolization and splash that is not captured here.
- The wind doubling factor above 15 mph is a simplified model. In practice, the effect is continuous and varies with fetch distance, surface roughness, and atmospheric stability -- the doubling approximation is conservative for most residential features.
- The calculator does not account for shading. A feature shaded for four or more hours per day during peak sun will evaporate meaningfully less than the tool suggests.
- Rainfall replenishment is not included. In humid climates with regular afternoon storms, actual net loss will be significantly lower than the gross evaporation figure.
- The formula is calibrated for air temperatures between 40 and 120°F. Inputs outside this range are rejected by the validator because the quadratic model becomes inaccurate at the extremes.
- Water temperature is assumed to approximate air temperature at the daily high. Deeper ponds or those in shaded settings may have cooler water temperatures and lower actual evaporation than calculated.
- Results are daily averages. Actual hour-by-hour loss during peak afternoon heat will exceed the daily average rate; overnight evaporation will be lower.
Standards, Safety Checks, and "Secret Sauce" Warnings
Critical Warnings
- The Burnt Pump Threshold: When a water feature's daily evaporation loss exceeds the volume delivered by a realistic manual fill session (typically 50 to 75 gallons from a 10 to 15-minute hose fill), running the pump without an auto-fill valve is no longer a judgment call -- it is a predictable failure mode. A pump that ingests air even briefly during a dry-run event generates heat in the motor housing that degrades the seal and winding insulation. Motors that "run dry" intermittently typically fail within one to three seasons without any other cause.
- Wind Is the Hidden Multiplier: Many pond owners build their water management habits around still-air summer readings. A site that regularly experiences afternoon wind speeds above 15 mph is not operating under the same physics. The boundary-layer disruption effect at those speeds mathematically doubles the evaporation rate. A 200-square-foot pond that loses 22 gallons per day at 10 mph wind can lose 39 gallons per day when wind increases to 20 mph -- with no change in temperature or humidity. This single variable is the most commonly underestimated factor in auto-fill sizing decisions.
- Shallow Features Fail Faster: The evaporation rate is calculated per unit of surface area, not volume. A shallow fountain basin with 6 inches of water depth loses a proportionally larger fraction of its total volume per day than a deeper koi pond. If your feature has less than 12 inches of operating depth, even moderate evaporation rates can drain the effective pump-intake zone within 48 hours.
- Auto-Fill Valve Sizing: The calculated GPM output is the minimum spec, not the target spec. Float valves should be sized at 1.5 to 2 times the calculated minimum to account for pressure fluctuation, partial closing during the refill cycle, and any line-length friction loss between the supply tap and the valve. For sizing the pump that moves water through your feature, cross-reference the waterfall pump calculator to confirm the recirculation circuit handles your full flow requirements.
Minimum Standards
- Any water feature with a calculated daily loss above 20 gallons should be equipped with an automatic water-level device. Manual maintenance at that volume is not sustainable across a full season without risk of pump damage.
- Supply lines for auto-fill valves serving features with more than 50 gallons per day of calculated loss should be 3/4-inch minimum to reduce friction loss and maintain adequate fill pressure. Running a high-demand valve on a long 1/2-inch line creates a flow restriction that prevents the valve from fully compensating.
- Submersible pumps used in features with auto-fill systems should include an auto-shutoff water-level sensor as a backup, independent of the float valve. Float valves can stick open or closed. A secondary water-level sensor protects both the pump and the surrounding landscape. If water management requirements extend to your broader irrigation design, the turf watering calculator can help you model the added demand on a shared supply line.
Competitor Trap: Most pond evaporation guides and calculators online present a single static evaporation rate for a given temperature -- typically 0.25 inches per day or some similar flat number -- and apply it universally. That approach ignores humidity (which can cut the effective rate in half), ignores wind speed entirely, and does not flag the 15 mph threshold where the underlying physics change. A homeowner in Phoenix and a homeowner in Atlanta with identical 200-square-foot ponds at identical temperatures are not experiencing the same evaporation. Treating them as equivalent leads to undersized auto-fill systems in dry climates and oversized ones in humid ones. The formula in this tool adjusts for all three variables simultaneously.
Common Mistakes and Fixes
Mistake: Measuring Total Pond Area Instead of Water Surface Area
Pond owners frequently enter the total landscaped footprint of their water feature, including planted margins, rock borders, and bog zones, rather than the area of open water surface. Evaporation occurs only from the water surface. Including non-water area inflates the result and leads to over-sizing the auto-fill system, increasing water consumption and operating costs unnecessarily.
Fix: Measure only the horizontal extent of exposed water. For irregularly shaped ponds, divide the surface into geometric sections, calculate each independently, and sum the results.
Mistake: Using Annual Average Temperature Instead of Seasonal Peak
Sizing an auto-fill valve on annual average temperatures produces a system that handles spring and fall conditions adequately but falls short in July and August -- exactly when the pump is at greatest risk. The temperature variable in the formula has a quadratic relationship, meaning the difference between 80°F and 100°F is not linear; the rate at 100°F is disproportionately higher than at 80°F.
Fix: Run the calculator using the average daily high for your hottest month. That is the design condition your auto-fill system must handle.
Mistake: Ignoring Wind Data Entirely
The most common gap in amateur pond evaporation estimates is the complete omission of wind speed. Features in exposed locations -- raised patios, hilltop properties, coastal yards -- regularly see afternoon wind speeds that cross the 15 mph threshold. Many pond owners have no idea what wind speed regularly occurs at their site and default to a "light breeze" assumption that may underestimate actual conditions by a factor of two.
Fix: Install an inexpensive anemometer near the feature for one week during typical weather and record the afternoon peak readings. That measured value is far more accurate than a guess. Water management on open sites is a broader design challenge; for sites with runoff concerns, a rain garden sizing calculator addresses the complementary problem of excess water on the same property.
Mistake: Selecting an Auto-Fill Valve Based on Brand Name Rather Than GPM Spec
Float valves are sold with descriptions like "heavy-duty" or "commercial grade" that describe build quality, not flow capacity. Two valves with identical branding may have entirely different flow rates depending on their orifice size, seat design, and inlet thread size. A valve rated at 0.25 GPM cannot compensate for a feature losing 0.074 GPM continuously if it is also cycling open and closed in response to level fluctuations.
Fix: Match the valve's rated flow (in GPM at your supply pressure) to the calculator's output, with a 1.5 to 2x safety margin. Request the manufacturer's flow specification by inlet size and supply pressure before purchasing.
Mistake: Treating the GPM Output as the Supply Line Size
The GPM figure in the calculator is the demand figure -- how much water the feature needs to replace per minute on a continuous basis. The supply line must be sized to deliver that volume at the end of its run, accounting for pressure drop due to friction loss over its length. A 50-foot run of 1/2-inch PVC at 50 psi may only deliver 1.5 GPM at the valve, even though the source can supply far more. For large or remotely located features, the supply line is often the limiting component.
Fix: Use a friction loss chart for your pipe diameter and length to verify that your supply line can actually deliver the needed GPM at the point of use. For features requiring a pressurized or solar-powered fill source, size the pump independently using a pump-sizing tool.
Next Steps in Your Workflow
Once you have the daily gallons figure and the required auto-fill GPM, the next decision is whether to use a passive gravity-fed float valve system or a timed solenoid valve on a digital water timer. For smaller features losing under 10 gallons per day, a brass float valve on a standard supply line is generally the simplest and most reliable solution. For larger features or those in areas with variable pressure, a solenoid-controlled timer with a low-water sensor provides more control and protection. If your water feature is in a location where grid power is unavailable or impractical, sizing a solar pump to handle both recirculation and auto-fill demand is worth modeling before selecting equipment.
Evaporation management is one piece of a pond's operational health. Water quality is the other. High evaporation periods concentrate dissolved minerals, nutrients, and waste products as volume decreases -- which accelerates algae growth and strains filtration. After confirming your auto-fill specification, check that your filtration and clarification equipment is correctly sized for the feature volume you are maintaining. The pond UV clarifier sizing tool on this site handles that calculation and can be run directly against the same surface area and volume figures you used here.
FAQ
How much water does a pond lose to evaporation per day?
It varies by surface area, temperature, wind, and humidity. A 200-square-foot pond in moderate summer conditions (85°F, 10 mph wind, 45% humidity) loses roughly 14 to 22 gallons per day to evaporation alone. Hot, dry, windy conditions can push that figure to 40 or more gallons on the same feature. Use the calculator above with your specific site conditions for an accurate figure rather than relying on a flat industry average.
What is the formula for calculating pond evaporation?
The core relationship is: gallons lost = surface area (sq ft) times (evaporation depth in inches per day divided by 12) times 7.48. The evaporation depth depends on temperature, humidity, and wind speed. This tool calculates the depth automatically from those inputs using a thermodynamic model, then converts to gallons. Detailed formula steps are available in the "How the Calculation Works" section above.
Does wind speed really double evaporation above 15 mph?
For open water surfaces, high wind speeds significantly disrupt the saturated vapor layer that naturally accumulates just above the water. Below 15 mph, wind adds a proportional increase. Above 15 mph, turbulent mixing continuously removes that protective layer and replaces it with drier air, creating a dramatically higher evaporation rate. The doubling factor applied in this calculator is a conservative approximation used in standard open-water evaporation models.
What size auto-fill valve do I need for my pond?
Start with the GPM output from the calculator, then select a float valve rated at 1.5 to 2 times that minimum. Also verify your supply line can deliver that flow rate at the valve after accounting for pipe length and friction loss. Most residential brass float valves on a 1/2-inch supply line handle up to 1 to 3 GPM at standard city pressure. For features needing more than 0.5 GPM, consider upgrading to a 3/4-inch supply line to reduce friction loss over the run.
How does humidity affect pond evaporation?
Humidity determines how much additional water vapor the air can absorb. At very low humidity, the vapor pressure deficit is large and water leaves the surface quickly. At high humidity, the air is already close to saturation and evaporation slows substantially. The same pond at 20% humidity evaporates at approximately four times the rate of an identical pond at 80% humidity, holding temperature and wind constant. This is why dry climates require much more aggressive auto-fill sizing than humid ones.
Is this calculator accurate for swimming pools?
The underlying physics apply to any open water surface, but swimming pool evaporation is influenced by additional factors this calculator does not model: bather activity, pool covers (which dramatically reduce losses), chemical treatment effects on surface tension, and the effect of pool heaters raising water temperature above ambient air temperature. For swimming pools specifically, a pool-specific evaporation tool that accounts for those factors will give more useful results. This calculator is optimized for still, unheated garden ponds and fountains.
Conclusion
The central insight from this tool is that pond evaporation is not a fixed, generic rate -- it is a product of three interacting variables, and wind is the one most frequently ignored. A water feature that appears manageable with weekly manual fills under calm conditions can become a pump-damaging liability the moment afternoon winds consistently exceed 15 mph. Running the numbers before installing your auto-fill system, rather than after a pump failure, is the difference between a well-maintained water feature and a recurring maintenance expense.
The single most consequential mistake is sizing the auto-fill valve to a calm-day, average-humidity estimate and then operating the feature during peak summer conditions where actual losses are two to three times higher. Run the calculator for your worst-case month, not your typical month, spec your supply line and valve to that demand figure, and verify your recirculation pump is rated for the volume you are actually maintaining. Those three steps, done in order, give you a water feature that runs reliably through August without emergency calls to a pond contractor.
Lead Data Architect
Umer Hayiat
Founder & Lead Data Architect at TheYieldGrid. I bridge the gap between complex agronomic data and practical growing, transforming verified agricultural science into accessible, mathematically precise tools and guides for serious growers.
View all tools & guides by Umer Hayiat →