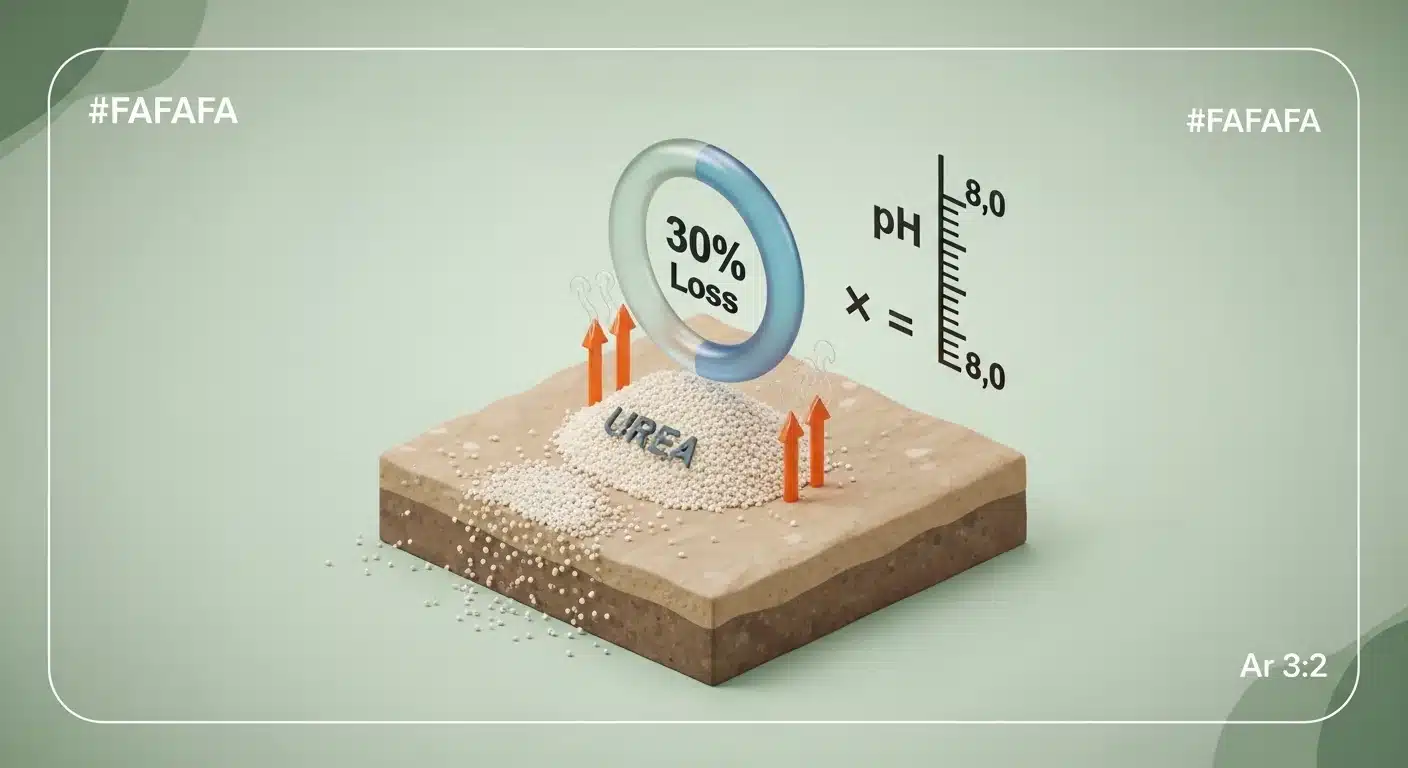

When urea fertilizer contacts moist soil, urease enzyme immediately begins converting it to ammonium carbonate, then to ammonia gas (NH3). That conversion is not slow or theoretical. At soil temperatures above 70°F with no rain in the forecast, the hydrolysis cycle can reach completion in 48 to 72 hours, sending a substantial fraction of your applied nitrogen directly into the atmosphere. The practical problem is that the conditions that accelerate urease activity, warm soil, alkaline pH, surface residue, and dry weather, are exactly the conditions that describe a typical spring topdress window.
This tool calculates estimated nitrogen loss as a percentage of applied rate, the equivalent pounds per acre volatilized, the direct financial cost of that loss, and whether NBPT urease inhibitor use is mandated or recommended under the entered conditions. It does not predict exact field outcomes, because actual losses vary with tillage history, surface residue cover, wind speed, and soil texture. What it does provide is a defensible, formula-driven estimate that separates low-risk conditions from the scenarios where unprotected urea is a genuinely poor agronomic decision. Thinking through your total nitrogen program, including how N is sourced and timed, connects to broader rate planning tools like the NPK calculator for a complete picture.
If the tool returns a financial loss figure that exceeds the cost of NBPT inhibitor ($4 to $6 per acre), the calculation makes the protection decision for you.
Use the Tool
Urea Ammonia Volatilization & NBPT Inhibitor Sizer
Calculate nitrogen loss risk, financial impact & urease inhibitor timing
Caution
Critical
| Wait Days | Temp (°F) | Loss % | N Lost (lbs/ac) | $ Lost /ac | Risk |
|---|
How This Calculator Works
Urease enzyme activity in soil drives the rate of urea hydrolysis to ammonia (NH₃). The risk window is 48–72 hours after application.
If Days ≥ 2 AND Temp > 70°F → Base Loss = 20%–30%
If Days ≥ 1 AND Temp > 60°F → Base Loss = 10%–20%
If Days = 0 OR Temp ≤ 50°F → Base Loss = 0%–5%
Higher soil pH (alkaline) increases ammonia volatilization because NH₃ is the dominant ammoniacal nitrogen form above pH 7.0.
pH 6.5–7.0 → modifier = 1.00 (baseline)
pH > 7.0 → modifier = 1.0 + (pH − 7.0) × 0.08 (up to 1.24 at pH 8.0)
Final Loss % = Base Loss × pH modifier (capped at 40%)
UAN 32% contains ~25% urea, ~25% ammonium nitrate, and ~50% water. The ammonium nitrate fraction does not volatilize; only the urea portion is at risk. A 0.5 factor is applied.
Financial Loss ($/ac) = Lost N × Cost per lb N
N Retained = Application Rate − Lost N
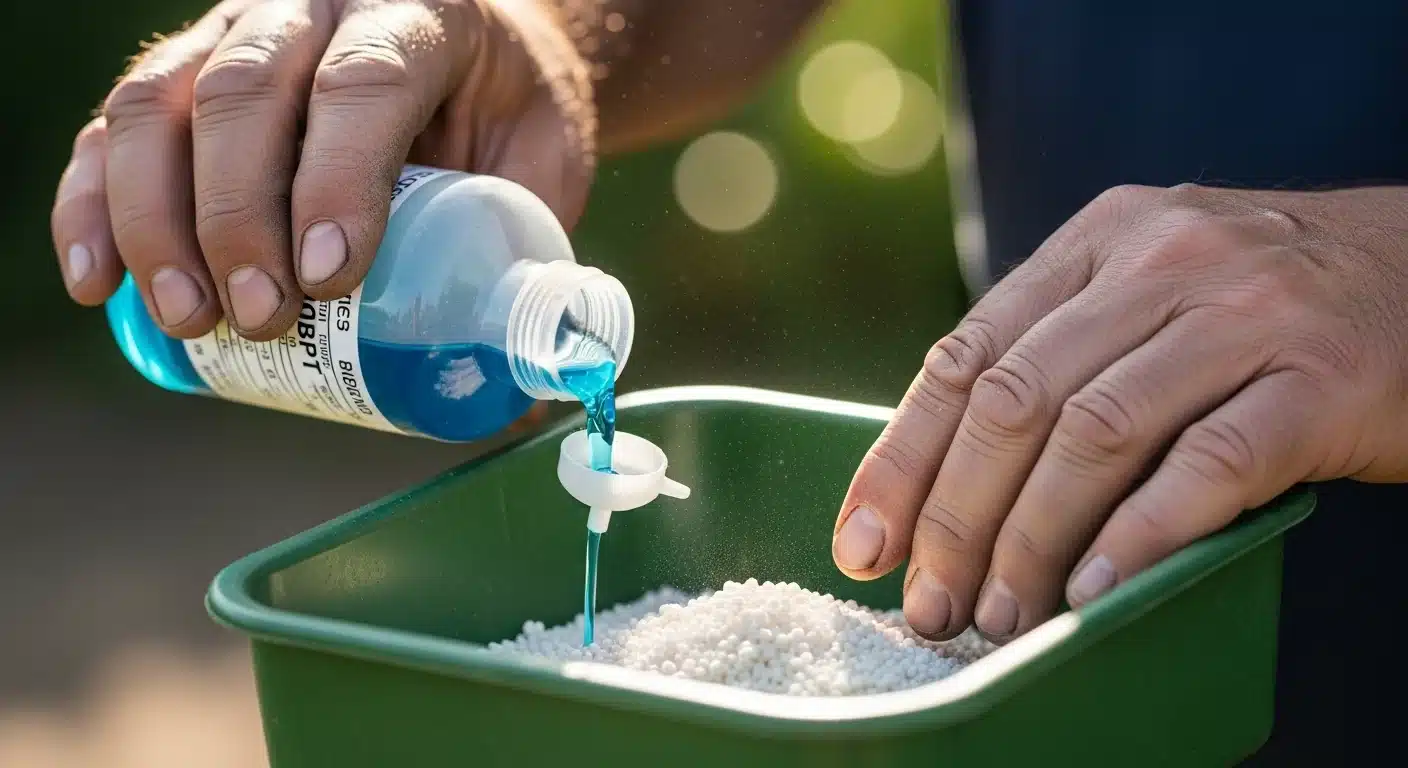
NBPT (N-butyl thiophosphoric triamide) blocks the urease enzyme. The tool mandates its use if Days ≥ 2, and strongly recommends it if Days ≥ 1 and Temp > 60°F.
Assumptions & Limits
- ⚠ Loss percentages are modeled ranges based on university extension research (University of Nebraska, LSU AgCenter, UK Extension). Actual losses vary with soil type, tillage, surface residue, and wind speed.
- ⚠ The 48-hour critical window assumes bare soil with no incorporation. Crop residue cover increases surface urease activity and can worsen volatilization.
- ⚠ Soil temperature is the most critical factor. This tool uses the input soil surface temperature — for accuracy, measure 2″ depth at time of application.
- ⚠ UAN 32% loss factor (0.50) is approximate. Surface-applied UAN still has significant urea-N at risk. Streaming or knife application further reduces volatilization.
- ⚠ NBPT inhibitor cost estimate ($4–6/acre) is for products such as Agrotain® at labeled rates. Compare against calculated financial loss to determine ROI.
- ⚠ This tool does not account for denitrification, leaching, or biological immobilization. Total actual N efficiency may differ.
- ⚠ Always consult local extension services for crop and soil-specific nitrogen management recommendations.
Before starting, have your fertilizer product confirmed (Urea 46-0-0 or UAN 32%), your planned application rate in pounds of actual nitrogen per acre, the current or forecast soil surface temperature in °F, your soil pH from a recent test, and the number of days until the next confirmed rain or irrigation event. For total nitrogen rate planning before you run this loss analysis, the nitrogen calculator can help establish your starting application target. Cost per pound of nitrogen can be derived from your fertilizer invoice: divide cost per ton by 2,000 to get cost per pound of product, then divide by the nitrogen fraction (0.46 for urea, 0.32 for UAN 32%).
Quick Start (60 Seconds)
- Fertilizer Type: Select Urea 46-0-0 for dry granular urea or UAN 32% for liquid solution. The tool applies a 0.50 reduction factor to UAN because only the urea fraction, roughly 25% of the product, is subject to volatilization. Do not select UAN if you are knife-applying or injecting below the soil surface.
- Application Rate (lbs N/acre): Enter actual nitrogen pounds per acre, not product pounds. For urea, multiply product lbs/acre by 0.46. For UAN 32%, multiply gallons/acre by 10.65 (weight) then by 0.32. Valid range is 1 to 500 lbs N/acre.
- Days Until Rain/Irrigation: Enter the most conservative (longest) estimate from your forecast. If there is a 40% chance of rain in 3 days and a near-certain event in 5 days, enter 5. The tool is designed to show worst-case within the forecast window.
- Soil Temperature (°F): Use the surface soil temperature at time of application, ideally measured at a 2-inch depth. Air temperature is not a reliable substitute. Soil temperature lags air temperature by 5 to 10 degrees in spring and holds heat longer in fall.
- Soil pH: Use a recent (within 2 years) lab soil test for the 0 to 6 inch horizon. Do not use estimated values. The pH modifier in the formula is sensitive: moving from pH 7.0 to pH 8.0 increases the model’s loss multiplier by 24%.
- Cost per lb N: Enter in dollars. Typical range is $0.45 to $0.80 per lb N depending on market conditions. This input drives the financial loss output only; it does not affect calculated nitrogen loss percentages.
- Click Calculate N Loss & Risk only after all six fields are filled. The form will not run and will not display results if any required field is empty or out of range.
Inputs and Outputs (What Each Field Means)
| Field | Unit | What It Represents | Most Common Mistake | Safe Entry Guidance |
|---|---|---|---|---|
| Fertilizer Type | Selection | Determines which hydrolysis rate model applies. Urea 46-0-0 carries full risk. UAN 32% carries 50% of full risk because half the nitrogen is in ammonium nitrate form. | Selecting UAN 32% when surface-streaming under high residue conditions, which can increase local urea concentration at the surface. | If applying via knife injection or subsurface band, volatilization risk is near zero regardless of product; this tool models surface or broadcast application only. |
| Application Rate | lbs N / Acre | Pounds of actual nitrogen applied per acre. This is the base for all loss and financial calculations. | Entering product pounds instead of nitrogen pounds. For urea, the product rate is always higher (1 lb N = 2.17 lbs of urea product). | Confirm from your rate plan. If your spreader is calibrated in product lbs/acre, multiply by 0.46 for urea or 0.32 for UAN 32%. |
| Days Until Rain | Days (0-30) | The forecast window before the next precipitation or irrigation event sufficient to move urea into the soil. Enter 0 only if rain is occurring at application time or within hours. | Using the optimistic forecast instead of the conservative one. Models show a nonlinear jump in loss at the 2-day and 3-day thresholds. | Check 7-day forecast from a reliable local source. Use the number of days for the last plausible rain event in the window, not the first. |
| Soil Temperature | °F (32-120) | Surface soil temperature, which directly controls urease enzyme activity rate. Urease is nearly inactive below 50°F and highly active above 70°F. | Using air temperature. On a 68°F air temperature day in late spring, soil surface can easily be 75°F or higher in direct sun. | Measure with a soil thermometer at 2 inches depth. Morning readings are cooler; midday readings better reflect the application window temperature. |
| Soil pH | pH units (4.0-9.0) | Soil acidity/alkalinity. Controls the NH3/NH4+ equilibrium. Above pH 7.0, the volatile NH3 form dominates, increasing gas-off rates. Below 6.5, loss is suppressed. | Using an outdated soil test or an average pH from fields with variable readings. High-pH areas within a field can create local hot spots for volatilization. | Use the pH value from your most recent certified lab soil test for the target field. If pH varies across zones, enter the highest value to model worst-case risk. |
| Cost per lb N | $ / lb N | Your actual nitrogen cost used to convert nitrogen loss into a dollar loss figure. Does not affect loss percentage calculations. | Entering cost per ton of product. Divide by 2,000 to get cost per pound of product, then divide by nitrogen fraction. | Derive from your most recent fertilizer invoice. Current market price per lb N for urea typically runs between $0.45 and $0.80. |
| Output: N Lost (lbs/ac) | lbs N / Acre | Estimated pounds of nitrogen per acre that volatilize to the atmosphere before rain incorporation. | Treating this as a guaranteed loss number. It is a modeled estimate based on average field conditions. | Use for comparative and decision purposes. Compare against NBPT inhibitor cost to evaluate protection ROI. |
| Output: Financial Loss | $ / Acre | Dollar value of estimated nitrogen lost, calculated as (N lost) x (cost per lb N). | Not accounting for yield loss value. The financial output only counts fertilizer replacement cost, not lost crop yield potential from N deficiency. | If the financial loss exceeds $5 to $6 per acre, NBPT inhibitor use has positive economic ROI based on typical inhibitor costs. |
Worked Examples (Real Numbers)
Example 1: High-Risk Cornbelt Broadcast (Late May, Warm & Dry Forecast)
- Fertilizer: Urea 46-0-0
- Application Rate: 120 lbs N/acre
- Days Until Rain: 5
- Soil Temperature: 78°F
- Soil pH: 7.2
- Cost per lb N: $0.65
Result: Base loss (days ≥3, temp >70°F) = 35%. pH modifier = 1.0 + (7.2 – 7.0) × 0.08 = 1.016. Final loss = 35% × 1.016 = 35.6%. N lost = 120 × 0.356 = 42.7 lbs N/acre. Financial loss = 42.7 × $0.65 = $27.76/acre. NBPT status: mandated.
At $27.76 per acre in projected nitrogen loss, NBPT inhibitor at $4 to $6 per acre delivers a 5:1 return on protection spend. This is the core “48-hour money pit” scenario described in extension research: warm, dry conditions with multiple days before any rain event.
Example 2: Moderate Risk Topdress (2-Day Rain Window, Neutral pH)
- Fertilizer: Urea 46-0-0
- Application Rate: 80 lbs N/acre
- Days Until Rain: 2
- Soil Temperature: 72°F
- Soil pH: 6.8
- Cost per lb N: $0.60
Result: Base loss (days ≥2, temp >70°F) = 25%. pH modifier = 1.00 (pH between 6.5 and 7.0). Final loss = 25%. N lost = 80 × 0.25 = 20 lbs N/acre. Financial loss = 20 × $0.60 = $12.00/acre. NBPT status: mandated.
Even at only 2 days without rain, a quarter of the applied nitrogen is at risk under warm conditions. The NBPT mandate threshold triggers at 2 days, and the $12/acre loss estimate justifies inhibitor use by a factor of 2 to 3.
Example 3: Low-Risk UAN Surface Application (Next-Day Rain Expected, Moderate Temp)
- Fertilizer: UAN 32%
- Application Rate: 100 lbs N/acre
- Days Until Rain: 1
- Soil Temperature: 65°F
- Soil pH: 6.5
- Cost per lb N: $0.55
Result: Base loss (days ≥1, temp >60°F) = 15%. pH modifier = 1.00 (boundary value at 6.5). UAN 32% factor = 0.50. Final loss = 15% × 0.50 = 7.5%. N lost = 100 × 0.075 = 7.5 lbs N/acre. Financial loss = 7.5 × $0.55 = $4.13/acre. NBPT status: recommended (not mandated).
This is the best-case scenario for surface-applied liquid nitrogen: a confirmed rain event within 24 hours, cooler soil, acidic-to-neutral pH, and a fertilizer product with reduced volatilization exposure. Loss is present but low enough that NBPT economic justification is borderline at typical product pricing.
Reference Table (Fast Lookup)
All values below use: Urea 46-0-0, 100 lbs N/acre applied, soil pH 6.8 (pH modifier = 1.00), cost $0.65/lb N. The “Days Until Rain” and “Soil Temp” columns are the decision variables. Use this for rapid field-side lookups.
| Days Until Rain | Soil Temp (°F) | Loss Rate | N Lost (lbs/ac) | Financial Loss ($/ac) | NBPT Status | Risk Level |
|---|---|---|---|---|---|---|
| 0 | 50 | 2.5% | 2.5 | $1.63 | Not required | Low |
| 0 | 72 | 2.5% | 2.5 | $1.63 | Not required | Low |
| 1 | 55 | 8% | 8.0 | $5.20 | Not required | Low |
| 1 | 65 | 15% | 15.0 | $9.75 | Recommended | Moderate |
| 1 | 75 | 15% | 15.0 | $9.75 | Recommended | Moderate |
| 2 | 65 | 15% | 15.0 | $9.75 | Mandated | Moderate |
| 2 | 75 | 25% | 25.0 | $16.25 | Mandated | Moderate |
| 3 | 65 | 15% | 15.0 | $9.75 | Mandated | Moderate |
| 3 | 75 | 35% | 35.0 | $22.75 | Mandated | Critical |
| 5 | 80 | 35% | 35.0 | $22.75 | Mandated | Critical |
Note: The temperature-only jump from 65°F to 75°F at 2 days without rain more than doubles financial loss from $9.75 to $16.25 per acre. Temperature is the single highest-leverage variable in the 2-day window.
How the Calculation Works (Formula + Assumptions)
Show the calculation steps
Step 1: Base Loss Rate from Timing and Temperature
The model uses a tiered lookup based on days without rain and soil temperature, which together proxy for urease enzyme activity duration and intensity:
- Days ≥3 AND temp >70°F → base loss = 35% (midpoint of the 30 to 40% field-observed range)
- Days ≥2 AND temp >70°F → base loss = 25% (midpoint of 20 to 30%)
- Days ≥1 AND temp >60°F → base loss = 15% (midpoint of 10 to 20%)
- Days = 0 OR temp ≤50°F → base loss = 2.5% (near-zero, minimal enzyme activity)
- All other conditions (1 to 2 days, 50 to 60°F) → base loss = 8%
Step 2: pH Modifier
Soil pH determines the NH3/NH4+ equilibrium. Above pH 7.0, the volatile ammonia form dominates:
- pH < 6.5 → modifier = 0.85 (suppressed loss)
- pH 6.5 to 7.0 → modifier = 1.00 (baseline, no adjustment)
- pH > 7.0 → modifier = 1.0 + (pH – 7.0) × 0.08 (capped at 1.30 at pH 8.75+)
The modified loss = base loss × pH modifier, capped at a maximum of 40%.
Step 3: UAN 32% Reduction Factor
UAN 32% is approximately 25% urea, 25% ammonium nitrate, and 50% water. The ammonium nitrate fraction does not hydrolyze to ammonia under surface conditions. The tool applies a 0.50 multiplier to the full urea loss rate: Final loss (UAN) = modified urea loss × 0.50.
Step 4: Loss and Financial Calculations
- N Lost (lbs/ac) = Application Rate (lbs N/ac) × Final Loss %
- Financial Loss ($/ac) = N Lost × Cost per lb N
- N Retained (lbs/ac) = Application Rate − N Lost
Rounding Rules
Loss percentage outputs are rounded to one decimal place. Nitrogen loss values are rounded to one decimal place. Financial loss values are rounded to two decimal places (cents).
Assumptions & Limits
- Loss percentages represent midpoints of university-reported ranges (University of Nebraska Extension, LSU AgCenter, UK Cooperative Extension). Actual field losses vary.
- The model assumes bare or lightly residue-covered soil. Heavy surface residue (no-till corn-on-corn) concentrates urease enzyme at the soil surface and can increase losses beyond modeled values.
- Soil surface temperature, not air temperature, is the correct input. Surface temperature can exceed air temperature by 5 to 15°F during midday application windows.
- The UAN 32% factor of 0.50 is a conservative approximation for surface-applied liquid. Surface-streamed UAN on high-residue fields may have higher loss than the model predicts because urea solution concentrates on residue surfaces where urease is abundant.
- The model does not account for wind speed, which increases NH3 gas dispersal and can raise actual losses above modeled values in open, windy conditions.
- NBPT inhibitor cost estimate of $4 to $6 per acre is based on typical retail pricing for Agrotain®-class products at labeled application rates. Verify current pricing with your supplier.
- Denitrification, leaching, and biological immobilization are not included. Total agronomic nitrogen efficiency will differ from the retained N output.
- The pH cap on the modifier (1.30) reflects the physical ceiling of NH3 dominance under field soil conditions. Highly alkaline soils (pH >8.5) may see further losses due to calcite precipitation effects not modeled here.
Standards, Safety Checks, and “Secret Sauce” Warnings
Critical Warnings
- The 48-Hour Hydrolysis Clock Starts at Contact. There is no waiting period before urease begins acting on broadcast urea. At 75°F soil temperature, urease converts urea to ammonium carbonate within 24 to 36 hours. Once the carbonate decomposes to NH3, no amount of rain can recover that nitrogen. The protection window is before application, not after.
- Alkaline Soils Compound Timing Risk Multiplicatively. A farmer with pH 7.5 soil and a 3-day dry window does not experience additive risk from those two factors. The pH modifier amplifies the base loss rate. At pH 7.5 and days ≥3 and temp >70°F, the model calculates 35% × 1.04 = 36.4% loss, versus the same scenario at pH 6.5, which returns only 35% × 0.85 = 29.8%. Regularly checking your soil pH with a tool like the soil pH lime calculator and correcting alkaline zones before N application is a long-term volatilization management strategy.
- NBPT Mandate Trigger: Days ≥2 Without Rain. The tool mandates NBPT inhibitor use at this threshold based on the agronomic standard that 2 dry days at warm temperatures are sufficient to convert a meaningful fraction of urea-N to volatile NH3. This is not a conservative safety margin. It reflects the midpoint of field-observed loss data at that threshold.
- UAN 32% Is Not “Safe” From Volatilization. The ammonium nitrate fraction in UAN does not volatilize, but the urea fraction is fully exposed. Surface-applied UAN in warm, dry conditions can still lose 7 to 17% of total applied nitrogen, which at 100 lbs N/acre and $0.65/lb represents $5 to $11 per acre in wasted fertilizer. Understanding how soil organic matter releases its own nitrogen pool can inform timing decisions alongside this tool; the soil organic matter nitrogen release tool provides that context.
Minimum Standards (Agronomic Benchmarks)
- Urea applications should be followed by at least 0.25 inches of rainfall or irrigation within 48 hours to move urea below the active urease zone (approximately 1 inch of soil depth).
- Surface application of unprotected urea when soil temperature exceeds 70°F and no rain is expected within 2 days should be considered agronomically below standard in most university extension nitrogen management frameworks.
- NBPT urease inhibitor at labeled rates is the minimum standard protective measure when application timing cannot be adjusted to precede a rain event.
Competitor Trap: Most urea volatilization content online presents loss risk as a general range (20% to 40%) without showing what conditions produce which outcome within that range. A farmer reading that range gets no actionable decision point. This tool forces specificity: the 48-hour window, the temperature threshold, the pH amplification effect, and the NBPT mandate trigger are all derived from the same formula the calculator uses. If a resource only tells you “losses can be significant,” it has not helped you decide anything.
Common Mistakes and Fixes
Mistake: Assuming Application Timing Can Be Adjusted After the Fact
Once urea granules are on the soil surface and soil moisture has activated urease, NH3 gas-off is already occurring. There is no post-application treatment that arrests volatilization once hydrolysis begins. Some growers attempt emergency irrigation after the forecast shifts, but even 0.10 inches of water may not move all urea into the soil in time if surface hydrolysis is already underway.
Fix: Make the go/no-go decision before application by entering your forecast into this tool and checking whether the output mandates NBPT. Do not rely on forecast-day-of-application checking when the application window is days earlier than expected rain.
Mistake: Using Air Temperature Instead of Soil Surface Temperature
A spring day with 65°F air temperature can have 75°F or higher soil surface temperature in direct sun, especially on dark, bare soils. Running the calculator with air temperature in this scenario would move the output from the “moderate” risk zone into a deceptively low-risk reading. This single input error is responsible for underestimating loss risk more often than any other user error.
Fix: Carry an inexpensive soil thermometer and measure at a 2-inch depth at the time of application, not in the morning before application. A fertilizer spreader calibration check is also a good time to take this reading; the spreader calibration calculator can help validate your application accuracy while you are already in the field.
Mistake: Selecting the Optimistic Rain Forecast Instead of the Conservative One
A forecast showing “40% chance of rain Thursday, near-certain Friday” is commonly interpreted as Thursday. The agronomically correct entry for this scenario is Friday (the certain event), which may be 4 or 5 days out instead of 3. The difference between 3 and 5 days is not meaningful in the model once both exceed the ≥3 day, >70°F threshold, but between 1 day and 2 days, the distinction triggers the NBPT mandate and roughly doubles the estimated loss rate.
Fix: Enter the last plausible rain date in the forecast window, not the first possible rain date. If you are uncertain, enter one additional day as a buffer.
Mistake: Applying Urea on Lawns or High-Traffic Turf Without Accounting for Volatilization
Lawn and turf urea applications are frequently done without considering volatilization timing, because the consequences are yield loss rather than visible crop stress. High-maintenance turf actually suffers more from volatilization losses because application rates are higher relative to root mass and turf responds visibly to nitrogen deficiency within days. The conditions that drive field-crop volatilization are identical for turf. A lawn fertilizer calculator can help establish your turf nitrogen rate, but this tool should be used alongside it when applying urea-based lawn products.
Fix: Use the same timing standards: water in within 48 hours of urea application to turf, or use a polymer-coated or NBPT-treated product if irrigation is not available.
Mistake: Treating Retained N as Crop-Available N Without Further Analysis
The “N Retained in Soil” output is not crop-available nitrogen. It is the nitrogen that did not volatilize. Retained nitrogen is still subject to leaching, denitrification, and immobilization losses that are not modeled here. Using the retained value as a direct input to a yield response model or fertilizer credit calculation overstates actual crop uptake.
Fix: Treat retained N as a maximum, not a guarantee. Factor in additional loss mechanisms (particularly leaching on coarse-textured soils) before using this number in any further calculation.
Next Steps in Your Workflow
Once you have calculated estimated volatilization loss, two paths diverge based on the output. If the financial loss exceeds NBPT inhibitor cost, the protection decision is economically clear, and the next action is sourcing an inhibitor product for your application date. If the loss is low or conditions are favorable, the next step is confirming your total nitrogen application is meeting crop demand, accounting for any credit from organic nitrogen sources. The manure nitrogen availability calculator helps quantify credits from organic applications in the same growing season, which should be subtracted from your synthetic N rate target before application.
For full nitrogen program management, volatilization loss is one of several efficiency factors. Salt stress on germinating crops is another consideration when high rates of soluble nitrogen are applied in close proximity to seeds, and the fertilizer salt index calculator can evaluate placement risk for split or combined applications. Ideally, this volatilization analysis integrates with your broader nutrient planning before you are standing at the field with a loaded spreader.
FAQ
What is the minimum rainfall needed to stop urea volatilization?
University extension research commonly cites 0.25 inches as the minimum rainfall needed to move urea granules into the soil below the active urease zone. Less than 0.25 inches may wet the surface without fully incorporating the urea, potentially accelerating hydrolysis by providing moisture without achieving incorporation depth. Irrigation can substitute for rainfall if timing is controllable.
Does NBPT inhibitor completely stop volatilization?
No. NBPT (N-butyl thiophosphoric triamide) suppresses urease enzyme activity by blocking the enzyme’s active site. Under typical field conditions at labeled application rates, NBPT extends the safe application window by 7 to 14 days compared to unprotected urea. It does not eliminate volatilization indefinitely. Extended dry periods exceeding 2 weeks can still result in losses even with inhibitor protection.
Is UAN 32% always safer than dry urea for surface applications?
Not always. Under high surface residue conditions (no-till systems), UAN solution applied as a surface stream or flat fan can pool on crop residue, where urease enzyme concentrations are often higher than in bare soil. In those situations, UAN can have higher volatilization losses than a dry urea application to bare soil. Knife injection of UAN eliminates this risk entirely.
How does surface residue affect the volatilization model?
The calculator models volatilization for bare or lightly residue-covered soil. Heavy surface residue significantly increases urease enzyme concentration at the soil surface, which can increase actual loss rates beyond model predictions. No-till corn following corn, for example, can have urease activity high enough to accelerate hydrolysis substantially, potentially pushing actual losses above the modeled ceiling.
At what soil temperature is urea application considered low risk?
Soil temperatures at or below 50°F suppress urease enzyme activity enough that volatilization loss drops to near-minimal levels regardless of rain timing. The model places the minimal loss floor at this threshold. Practically, spring applications before soils warm above 50°F carry the lowest inherent volatilization risk, which is one reason fall and very early spring urea applications historically show lower loss rates than late spring topdress timing.
Can I use this calculator for ammonium sulfate or DAP applications?
No. This tool is specifically calibrated for urea (46-0-0) and UAN 32%, both of which undergo urease-driven hydrolysis to volatile ammonia. Ammonium sulfate, DAP, and MAP have different nitrogen forms. Ammonium sulfate converts to ammonia only under high pH conditions, and DAP has some volatilization risk at very high pH (above 8.0), but neither product fits the hydrolysis pathway this model is built on. A separate tool would be needed for those products.
Conclusion
The core differentiator of this calculator over general volatilization guidance is specificity. A farmer can enter their actual soil temperature, their actual pH, their actual dry forecast window, and get a dollar figure rather than a percentage range. The 48-hour hydrolysis window is not a worst-case theoretical scenario; it is the normal outcome when warm soil, dry conditions, and surface-applied urea coincide. Knowing that a specific application scenario will likely cost $22 per acre in lost nitrogen versus $4 to $6 for inhibitor protection is what moves this from a general principle to a field-level decision.
The single most common mistake this tool helps prevent is applying unprotected urea based on an optimistic forecast and then watching that forecast shift. The NBPT mandate at 2 days without rain is not a conservative threshold. It is where the data places the protection crossover point. If your calculated financial loss exceeds your inhibitor cost, the math has made the recommendation. Total nitrogen planning, including understanding how soil organic matter and other amendments contribute to your crop’s nitrogen supply, is well served by the NPK fertilizer calculator as a complementary planning step once you have accounted for what will actually stay in the soil.

Lead Data Architect
Umer Hayiat
Founder & Lead Data Architect at TheYieldGrid. I bridge the gap between complex agronomic data and practical growing, transforming verified agricultural science into accessible, mathematically precise tools and guides for serious growers.
View all tools & guides by Umer Hayiat →


