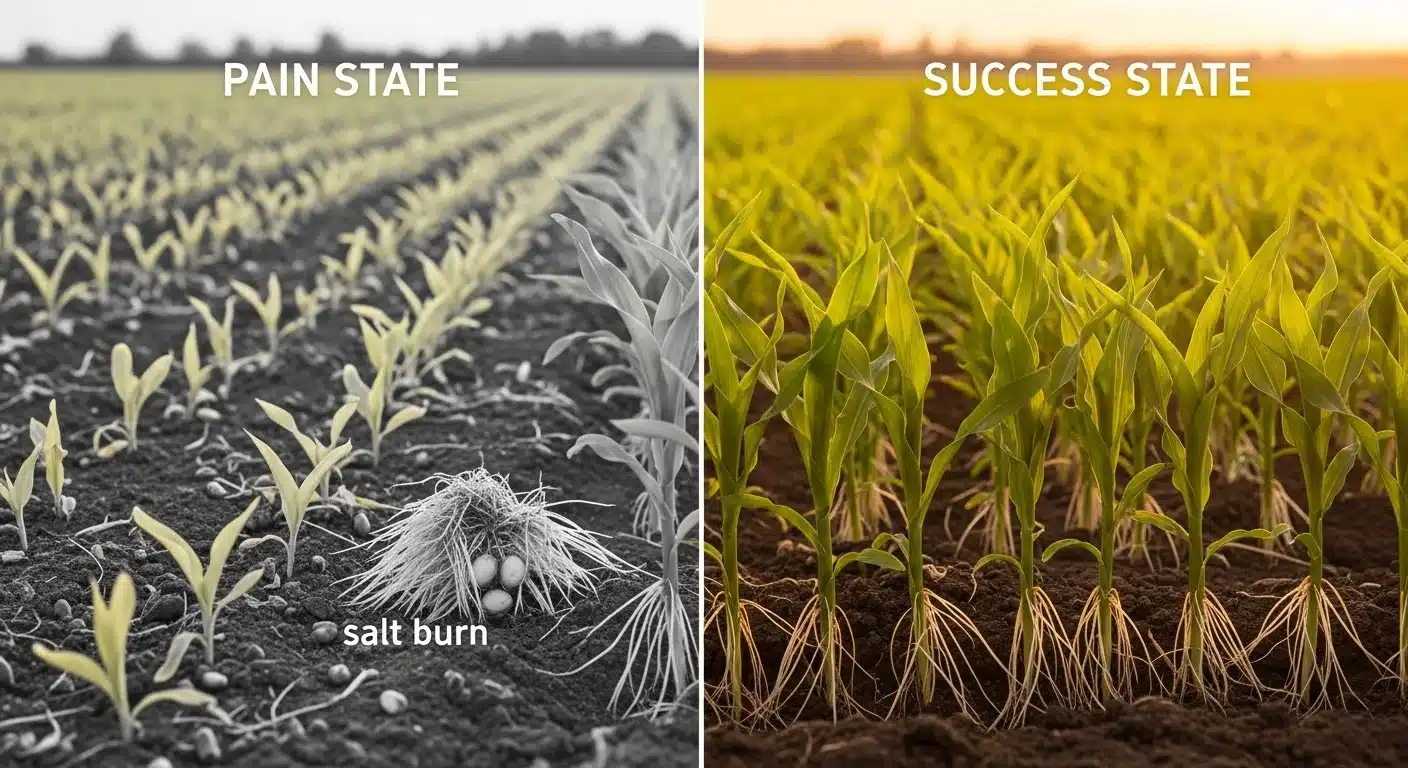
Seedling death from in-furrow fertilizer rarely looks like fertilizer damage. The stand thins out unevenly, emergence is patchy, and the soil looks fine. What happened underground is a chemistry problem: the fertilizer solution surrounding the seed created an osmotic environment more concentrated than the seed’s own cellular fluid. Water moved out of the germinating seed rather than into it. That process, plasmolysis, is irreversible once it starts and it is entirely preventable if the salt load is calculated before application.
This tool calculates the salt index of your fertilizer blend based on its nitrogen and potassium percentages, then computes the applied N+K load per acre at your target rate and compares that against soil-texture-specific and crop-specific safety thresholds. It does not replace a soil test, it does not account for every liquid blend formulation on the market, and it does not predict yield. What it does is flag, with a traffic-light system, whether your in-furrow rate crosses into phytotoxicity territory before you leave the shop. If you are also working out final blend ratios, the NPK fertilizer calculator can help you verify your analysis numbers before entering them here.
Bottom line: If the tool returns a Danger result, reduce your in-furrow gallons per acre, switch to 2×2 placement, or reformulate with a lower-salt source before planting.
Use the Tool
How This Calculator Works
Formula Overview
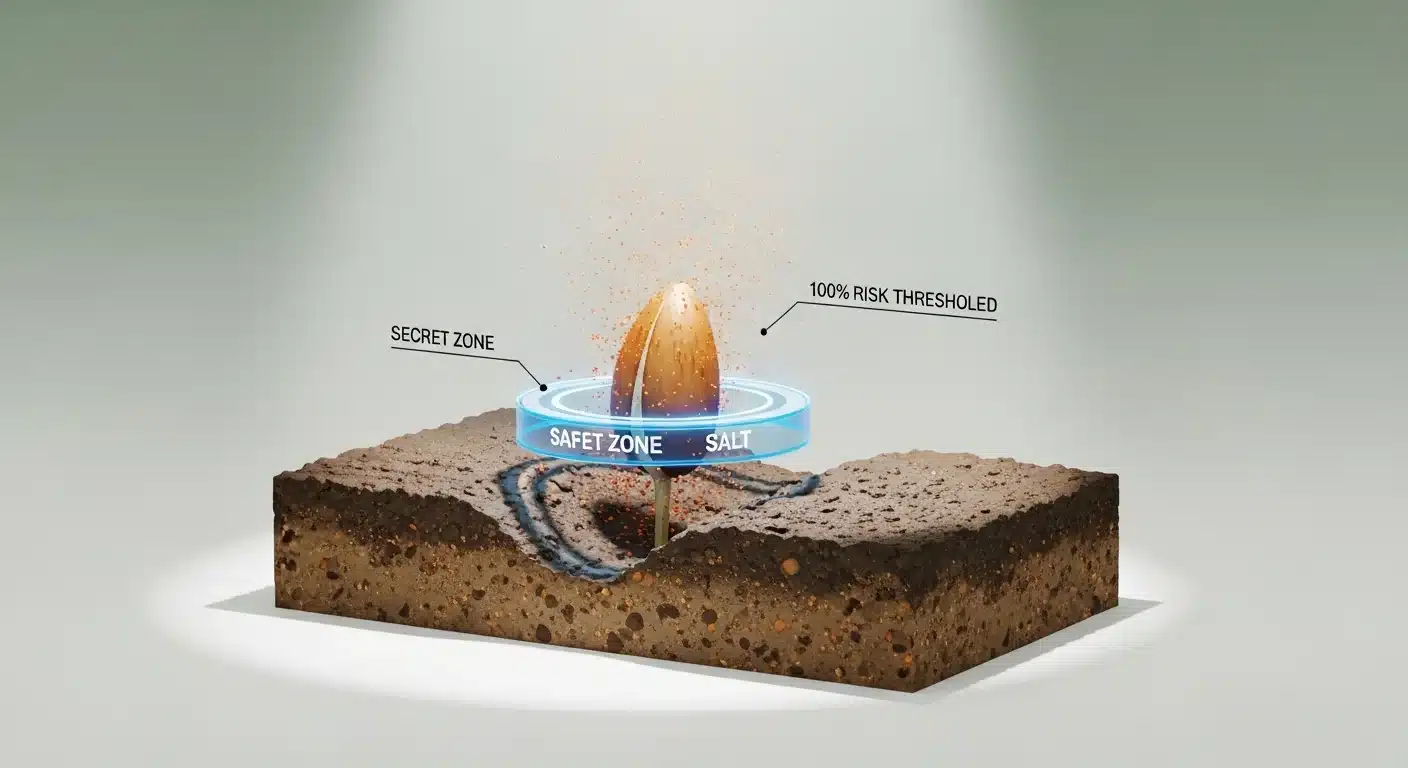
The Salt Index quantifies the osmotic pressure a fertilizer creates relative to sodium nitrate. High salt index materials placed in direct seed contact can desiccate germinating seeds via plasmolysis — the seed loses cellular water to the high-concentration solution.
Step 1 – Calculate Applied lbs N+K per Acre
Applied_N_K = Rate_gal_acre × Applied_lbs_per_gal
Typical liquid solution densities: UAN 28-0-0 ≈ 10.6 lb/gal; 10-34-0 ≈ 11.7 lb/gal. We use 10.84 (N) and 11.12 (K) as representative nutrient density coefficients.
Step 2 – Determine Maximum Safe Rate
Loam soil: Max_Safe = 6.5 lbs N+K per Acre
Clay soil: Max_Safe = 8 lbs N+K per Acre
Step 3 – Compute Salt Index Score
Coefficients represent each nutrient’s relative salt index contribution (Rader 1943, updated). N score 1.69, K score 1.57 per unit percent.
Step 4 – Risk Classification
Safe: Ratio ≤ 0.75 | Caution: 0.75–1.0 | Danger (Plasmolysis): > 1.0
Assumptions & Limits
- Model assumes in-furrow application directly at seed. 2×2 placement significantly reduces risk.
- Crop sensitivity modifiers based on seed size and hull protection (Corn most tolerant; Soybeans most sensitive).
- Soil moisture at application affects actual osmotic risk — dry soils concentrate salts further.
- Results are estimates. Always consult local extension agronomist guidelines for final recommendations.
- Phosphorus (P₂O₅) has a relative salt index of ~0.10 and is excluded from primary N+K risk calculation.
Assumptions & Limitations
Placement Assumptions
This calculator assumes in-furrow placement — fertilizer in direct seed contact. Risk thresholds increase by ~30–40% for 2×2 placement (2 inches to the side and 2 inches below the seed).
Crop Sensitivity Modifiers Applied
- Corn: Seed hull offers moderate protection. Tolerance factor 1.00×
- Soybeans: Thin-hulled, cotyledons exposed early. Sensitivity factor 0.80× (20% lower effective max safe rate)
- Wheat: Small seed, high surface-area-to-volume ratio. Sensitivity factor 0.85×
- Cotton: Requires warm, moist germination. Sensitivity factor 0.85×
- Sorghum: Relatively salt-tolerant. Sensitivity factor 1.10×
Soil Moisture Effects
Dry soils concentrate applied salts in smaller soil solution volume, increasing osmotic potential. In drought conditions, reduce applied rates by 25–30% below calculated safe thresholds.
Data Sources
Salt Index coefficients: Rader (1943), updated per IPNI Reference. Soil texture thresholds: University of Minnesota Extension, Purdue Agronomy. Risk classifications: Iowa State University Extension Starter Fertilizer Guidelines.
Before you start, have your fertilizer label open. You will need the guaranteed analysis (N-P-K percentages), your planned application rate in gallons per acre, your crop, and your predominant soil texture. If you are applying a blended solution, use the total N% and total K₂O% of the finished mix. For diluted tank mixes, calculate the effective N% and K% of the final solution at application concentration before entering those values. The fertilizer dilution calculator can convert concentrated product rates to effective percentages if needed.
Quick Start (60 Seconds)
- Crop Type: Select the crop you are planting. Soybeans and wheat carry lower tolerance thresholds than corn; the calculator adjusts the safe limit automatically. Do not select a generic “row crop” option and assume it covers all species equally.
- Soil Texture: Choose Sandy, Loam, or Clay based on your dominant soil type in the field, not the whole farm average. Sandy soils dilute applied salt across less soil solution volume, so they have lower safe thresholds.
- Nitrogen % (N): Enter the N value directly from the fertilizer label. For UAN 28-0-0, enter 28. For a 10-34-0 starter, enter 10. Range: 0 to 46.
- Potassium % (K₂O): Enter the K₂O figure, not elemental K. Muriate of Potash is roughly 60-62% K₂O. If your fertilizer contains no potassium, enter 0. This is the field that most often causes dangerous underestimates when left blank incorrectly.
- Phosphorus % (P₂O₅): This field is optional. Phosphate contributes a very low relative salt index and does not meaningfully change the risk calculation; it is included for completeness when working with 10-34-0 or MAP blends.
- Application Rate (gal/acre): Enter gallons of the finished solution per acre, not product concentrate. Verify your pump calibration against actual flow before trusting a nominal rate. Common error: entering fluid ounces or liters instead of gallons.
- Click Calculate Salt Index & Risk only after all required fields are complete. The tool will not run on partial inputs.
Inputs and Outputs (What Each Field Means)
| Field | Unit | What It Means | Common Mistake | Safe Entry Guidance |
|---|---|---|---|---|
| Crop Type | Category | Sets the crop sensitivity multiplier applied to the base soil max rate | Assuming corn thresholds apply to soybeans | Always select the actual crop being planted that day |
| Soil Texture | Category | Determines baseline maximum safe N+K load; sandy soils hold less buffering capacity | Selecting “Loam” for a field with significant sandy variability | Use the most sandy texture present in the field, not an average |
| Nitrogen % (N) | % | Drives the largest portion of the salt index score; N coefficient = 1.69 | Entering lb N/acre instead of label percentage | Read directly from the guaranteed analysis on the product label (0-46) |
| Potassium % (K₂O) | % | Second highest salt index driver; KCl sources are extreme risk; K₂O coefficient = 1.57 | Leaving this at 0 when a potassium source is blended in | Use K₂O percentage, not elemental K; for KCl, use 60-62% range (0-62) |
| Phosphorus % (P₂O₅) | % | Low salt index contribution; informational only; not used in primary risk calculation | Assuming 10-34-0 is safe because it is phosphate-dominant | Optional; enter label P₂O₅% if desired for completeness (0-54) |
| Application Rate | gal/acre | Determines total lb N+K delivered per acre; rate directly multiplies the risk | Using a nominal pump setting without field-verifying actual flow rate | Calibrate against measured output before entering; use gallons per acre (0.1-200) |
| Salt Index Score | Unitless score | Relative osmotic pressure rating of the fertilizer blend; not a direct measure of field safety | Treating a low score as automatically safe at any rate | Use in combination with the applied N+K and risk ratio outputs |
| Applied N+K | lbs/acre | Total pounds of N and K₂O nutrients delivered per acre at the entered rate | Ignoring this number if the salt index score appears low | Compare directly against Max Safe Rate output |
| Max Safe Rate | lbs N+K/acre | Adjusted threshold: base soil limit multiplied by crop sensitivity factor | Using a generic industry threshold without crop or soil adjustment | This value varies by crop and soil; do not apply the same number across all situations |
| Risk Ratio | % of max safe rate | Primary decision output: applied load as a fraction of the adjusted safe threshold | Treating anything under 100% as equally safe | 75% or below is the safe zone; 75-100% is caution; above 100% is active phytotoxicity risk |
For context on how nitrogen inputs relate to broader fertility programs, the nitrogen calculator can help cross-check total N application across all sources before finalizing your in-furrow rate.
Worked Examples (Real Numbers)
Scenario 1: Corn on Loam Soil with UAN 28-0-0 at 2 gal/acre
- Crop: Corn (sensitivity factor 1.00)
- Soil Texture: Loam (base max = 6.5 lbs N+K/acre)
- Fertilizer: 28-0-0 (N = 28%, K₂O = 0%)
- Application Rate: 2 gal/acre
Applied N+K = 2 x (28 x 0.1084 + 0 x 0.1112) = 2 x 3.035 = 6.07 lbs/acre
Max Safe Rate = 6.5 x 1.00 = 6.5 lbs/acre
Salt Index Score = 28 x 1.69 + 0 x 1.57 = 47.3
Risk Ratio = 6.07 / 6.5 = 93.4%
Result: CAUTION. Applied load is approaching the safe limit. Any increase in rate, any drier-than-expected soil, or any field variability toward sandier texture would push this into the Danger zone. This rate would require downward adjustment to stay clearly safe for sensitive establishment conditions.
Scenario 2: Soybeans on Sandy Soil with 10-34-0 at 5 gal/acre
- Crop: Soybeans (sensitivity factor 0.80)
- Soil Texture: Sandy (base max = 5.0 lbs N+K/acre)
- Fertilizer: 10-34-0 (N = 10%, K₂O = 0%)
- Application Rate: 5 gal/acre
Applied N+K = 5 x (10 x 0.1084 + 0 x 0.1112) = 5 x 1.084 = 5.42 lbs/acre
Max Safe Rate = 5.0 x 0.80 = 4.0 lbs/acre
Salt Index Score = 10 x 1.69 + 0 x 1.57 = 16.9
Risk Ratio = 5.42 / 4.0 = 135.5%
Result: DANGER. This scenario is a textbook example of why a low salt index score does not automatically indicate safety. 10-34-0 has a low score, but at 5 gal/acre on sandy soil with soybeans, the applied load is 35% above the adjusted safe limit. Reducing to 3.7 gal/acre or moving to 2×2 placement resolves the risk.
Scenario 3: Corn on Clay Soil with 10-34-0 at 3 gal/acre
- Crop: Corn (sensitivity factor 1.00)
- Soil Texture: Clay (base max = 8.0 lbs N+K/acre)
- Fertilizer: 10-34-0 (N = 10%, K₂O = 0%)
- Application Rate: 3 gal/acre
Applied N+K = 3 x (10 x 0.1084 + 0 x 0.1112) = 3 x 1.084 = 3.25 lbs/acre
Max Safe Rate = 8.0 x 1.00 = 8.0 lbs/acre
Salt Index Score = 10 x 1.69 + 0 x 1.57 = 16.9
Risk Ratio = 3.25 / 8.0 = 40.6%
Result: SAFE. Clay soil’s higher buffering capacity, combined with a low-salt starter formula and a conservative rate, produces a comfortable margin. This combination is a reliable baseline for corn growers concerned about phytotoxicity risk on heavier ground.
Reference Table (Fast Lookup)
The table below shows common starter fertilizer products applied at typical in-furrow rates across soil textures and crops. The “Risk Zone” column is computed directly from the formula using the base soil thresholds and standard crop sensitivity factors. Soybean values use the 0.80 sensitivity factor; corn uses 1.00.
| Fertilizer | Analysis | Rate (gal/ac) | Applied N+K (lbs/ac) | Salt Index Score | Risk Zone (Sandy/Corn) | Risk Zone (Sandy/Soy) |
|---|---|---|---|---|---|---|
| UAN Solution | 28-0-0 | 2 | 6.07 | 47.3 | DANGER (121%) | DANGER (152%) |
| UAN Solution | 28-0-0 | 1 | 3.04 | 47.3 | SAFE (61%) | CAUTION (76%) |
| Starter 10-34-0 | 10-34-0 | 3 | 3.25 | 16.9 | SAFE (65%) | SAFE (81%)* |
| Starter 10-34-0 | 10-34-0 | 5 | 5.42 | 16.9 | CAUTION (108%) | DANGER (136%) |
| 6-24-6 Starter | 6-24-6 | 3 | 2.63 | 19.6 | SAFE (53%) | SAFE (66%) |
| N+K Blend | 10-0-10 | 3 | 6.54 | 32.6 | DANGER (131%) | DANGER (164%) |
| N+K Blend | 10-0-10 | 2 | 4.36 | 32.6 | SAFE (87%)* | DANGER (109%) |
| High-N Blend | 32-0-0 | 1.5 | 5.21 | 54.1 | CAUTION (104%) | DANGER (130%) |
| KCl in-furrow test | 0-0-60 | 1 | 6.67 | 94.2 | DANGER (133%) | DANGER (167%) |
* Values near or just above 75% should be treated as caution-zone in practice given field variability. Applied N+K = Rate x (N% x 0.1084 + K% x 0.1112). Risk = Applied / (Base Soil Max x Crop Factor).
How the Calculation Works (Formula + Assumptions)
Show the calculation steps
Step 1: Compute Applied N+K Pounds per Acre
The calculator converts fertilizer percentages to applied nutrient mass using density-adjusted coefficients:
Applied_N_K = Rate (gal/ac) x [ (N% x 0.1084) + (K% x 0.1112) ]
The coefficients 0.1084 and 0.1112 represent pounds of N and K₂O, respectively, delivered per gallon per percentage point of nutrient content. These are derived from representative liquid solution densities: UAN 28-0-0 at approximately 10.6 lb/gal and 10-34-0 at approximately 11.7 lb/gal, averaged for the nutrient fractions.
Step 2: Determine Adjusted Maximum Safe Rate
Max_Safe = Base_Soil_Max x Crop_Sensitivity_Factor
Sandy = 5.0 lbs N+K/acre  |  Loam = 6.5  |  Clay = 8.0
Corn = 1.00  |  Soybeans = 0.80  |  Wheat = 0.85  |  Cotton = 0.85  |  Sorghum = 1.10
Step 3: Compute Salt Index Score
Salt_Index = (N% x 1.69) + (K% x 1.57)
These are relative salt index coefficients based on Rader (1943), subsequently updated by IPNI and land-grant university extension references. The index is a unitless score representing osmotic activity relative to sodium nitrate.
Step 4: Risk Classification
Risk_Ratio = Applied_N_K / Max_Safe
Safe: Risk_Ratio <= 0.75  |  Caution: 0.75 to 1.0  |  Danger: > 1.0
Rounding Rules
Applied N+K and max safe rate are displayed to two decimal places. Risk ratio is displayed as a whole number percentage. Salt index score is displayed to one decimal place.
Assumptions and Limits
- The model assumes in-furrow placement with direct seed contact. Actual risk for 2×2 placement (2 inches to the side, 2 inches below the seed) is substantially lower and would allow considerably higher nutrient loads.
- Density coefficients are representative averages. Products that deviate significantly from typical UAN or standard starter densities will produce slightly different applied lb/gal values. Check product-specific density if precision is required.
- Soil moisture at the time of application is not a model input. Dry soils concentrate the applied solution in less soil water, increasing effective osmotic potential beyond what the calculator predicts. In drought conditions, apply a conservative buffer by targeting the lower end of the safe zone.
- The crop sensitivity factors used are based on published extension research for typical cultivars. Treated seeds, seed coatings, or unusually small seed lots may alter effective tolerance.
- Soil texture is entered as a single category. Fields with spatial variability across texture classes should be run at the sandiest texture present to avoid under-predicting risk in sensitive zones.
- The salt index formula does not account for interactions between multiple nutrient sources in the same solution. Tank mixing high-index materials may produce additive osmotic effects not fully captured in the separate per-nutrient coefficients.
- Results are for educational and planning purposes. Final agronomic decisions should incorporate a current soil test, product-specific technical data sheets, and consultation with a certified crop adviser where required by local regulations.
To understand how soil physical properties affect how nutrients move and concentrate near the seed zone, the soil bulk density calculator provides a useful reference point for evaluating your soil structure before planning starter applications.
Standards, Safety Checks, and “Secret Sauce” Warnings
Critical Warnings
- The Plasmolysis Threshold Is Not Forgiving: Once osmotic potential in the seed zone exceeds cellular concentration in the germinating seed, water efflux begins within hours. There is no field intervention that reverses this. The only corrective measure is prevention: calculate before application, not after stand establishment fails.
- Muriate of Potash (KCl) Is a Special Hazard: KCl carries a relative salt index exceeding 116. At even 1 gal/acre in-furrow, a 0-0-60 source delivers enough K₂O to exceed safe thresholds on sandy soils for most crops. Sulfate of Potash (SOP), at a salt index around 46, is a substantially lower-risk potassium source for in-furrow use.
- Low Salt Index Score Does Not Mean Low Risk at High Rates: 10-34-0 has one of the lowest salt index scores among common starters, but Scenario 2 above demonstrates that at 5 gal/acre on sandy soil with soybeans, it still exceeds the safe rate by over 35%. Rate and soil context determine actual phytotoxicity risk; the score alone is only half the picture.
- Soil Moisture Amplification: The thresholds in this model assume adequate soil moisture at planting. Dry seedbeds concentrate dissolved salts in a smaller volume of soil solution. Under drought-stressed soil conditions, the effective safe rate may be substantially lower than the model output suggests.
Minimum Standards for In-Furrow Application
- Applied N+K load should remain at or below 75% of the calculated Max Safe Rate for comfortable clearance on in-furrow placement.
- For soybeans, the adjusted max safe rate on sandy soil is 4.0 lbs N+K/acre. This figure should be treated as a firm ceiling, not a guideline, given soybean sensitivity during early germination.
- Any fertilizer blend containing KCl should be flagged for alternative sourcing or moved to 2×2 placement rather than in-furrow contact, regardless of the rate.
- Applications on sandy soils during dry springs should use the Clay threshold as a conservative proxy, or reduce the calculated safe rate by at least 20%.
Competitor Trap: Many “fertilizer burn calculators” online focus exclusively on salt index score as the decision variable. They present a number, compare it against a generic threshold, and call it safe or unsafe. This misses the second half of the problem entirely. A product with a low index score applied at a high rate on sandy soil with a sensitive crop can easily exceed the plasmolysis threshold. The actual risk is a function of applied pounds per acre delivered, not of the index score in isolation. Any tool that omits rate, soil texture, or crop sensitivity from its analysis is incomplete.
When evaluating nitrogen sources for in-furrow programs, the manure nitrogen availability calculator is useful for growers who incorporate organic N sources and need to account for mineralization timing before adding synthetic supplements. Understanding total available N prevents overcalculation when multiple sources are in the system.
Common Mistakes and Fixes
Mistake: Using Corn Thresholds for Soybeans
Soybeans emerge with cotyledons exposed early in germination, and their seed hull offers less physical protection against osmotic stress than corn. Applying the same in-furrow rate that works safely for corn frequently exceeds the adjusted safe threshold for soybeans on the same field. The crop-specific sensitivity factor in this calculator accounts for a 20% reduction in effective tolerance for soybeans relative to corn.
Fix: Always run the calculator separately for each crop you are planting, even if the soil and fertilizer product are the same across fields.
Mistake: Treating the Rate as Fixed and the Formula as Variable
Some growers decide on a gallon-per-acre rate first based on equipment settings and then try to find a product that “scores safe.” The more defensible approach is to determine the safe rate ceiling from the formula first, then calibrate equipment to that rate. Working backward from a desired rate often results in rationalization of borderline inputs.
Fix: Use the calculator to establish the maximum allowable applied N+K load, then determine what rate of your specific product delivers that load.
Mistake: Not Accounting for Blended Tank Mixes
When multiple fertilizer products are combined in the same tank and applied in a single in-furrow pass, their total N and K contributions must be summed before entering values in the calculator. Entering only the primary product’s analysis while a potassium supplement is also in the mix will dramatically underestimate salt load. This is one of the most common sources of unexplained stand damage in fields where a “proven safe” starter product was used.
Fix: Calculate the weighted N% and K% of the full tank mix before entering them. The fertilizer spreader calibration calculator can help confirm actual product delivery rates when checking equipment output for multi-product applications.
Mistake: Applying Standard Rates on Sandy Knolls Without Adjustment
A field classified as Loam by average texture analysis may contain significant sandy knoll areas that behave more like Sandy soil in terms of buffering capacity. Applying a rate calculated to be safe for Loam to a planter pass through sandy variability zones will exceed the threshold in those areas without triggering the calculator’s warning.
Fix: If the field has texture variability, run the calculator at the Sandy texture setting and use that rate uniformly, or use variable-rate planting technology to adjust application in real time.
Mistake: Skipping the K₂O Field When No Dedicated Potassium Source Is Used
Many formulated starter products contain trace K₂O that is not prominently displayed on the label because it is not a primary selling point. Leaving the K₂O field at zero when the guaranteed analysis actually shows a K value, even a small one, underestimates the salt index score. On high-N products, a 3-5% K₂O addition can shift the risk ratio meaningfully on sandy soils.
Fix: Read the complete guaranteed analysis label for every product in the tank, including micronutrient packages that may contain potassium sulfate or similar.
Next Steps in Your Workflow
Once you have a Safe result, the work is not finished. Confirm that your pump calibration at the field matches the rate you entered in the calculator. Equipment wear, temperature changes, and varying ground speed all affect actual delivery. A rate that scores Safe at 3 gal/acre on the calculator but delivers 4.2 gal/acre in the field due to an uncalibrated pump is effectively a different scenario. After calibration, revisit the result with the actual delivered rate before committing to a full field run. The NPK calculator is useful for verifying that your total nutrient program across all application passes still meets crop demand after you adjust your in-furrow rate downward.
If you are working through a broader soil fertility program, the salt index calculation is one decision point among several. Total fertilizer load, soil pH, and organic matter levels all interact with starter performance. The liquid fertilizer weight per gallon reference tool helps confirm product density when converting between volume-based and weight-based application records, which matters when cross-checking your lab’s soil test recommendations against applied pounds per acre.
FAQ
What is the fertilizer salt index and why does it matter for in-furrow applications?
The salt index is a unitless score that measures how much osmotic potential a fertilizer creates relative to sodium nitrate. It matters for in-furrow applications because fertilizer placed in direct contact with a germinating seed creates a localized high-salt environment. If that environment is more concentrated than the seed’s own cellular fluid, water moves out of the seed, disrupting germination. The higher the index, the greater the osmotic risk per unit of nutrient applied.
Which fertilizers have the highest risk of causing seed burn?
Muriate of Potash (KCl, 0-0-60) has one of the highest relative salt indexes of common crop inputs, exceeding 116. UAN solutions at 28% and 32% nitrogen also carry high scores above 47. Anhydrous ammonia, when accidentally introduced near the seed zone, is extreme. Lower-risk options for in-furrow programs include 10-34-0 and formulated low-salt starters such as 6-24-6.
Does soil type change how dangerous in-furrow fertilizer is?
Directly, yes. Sandy soils have less clay and organic matter to buffer the osmotic concentration of an applied solution. The same fertilizer at the same rate creates a higher effective salt concentration in sandy soil solution compared to loam or clay. This calculator adjusts the maximum safe N+K threshold based on soil texture: sandy soils receive a base limit of 5 lbs N+K per acre, loam 6.5, and clay 8.
Can I use this calculator for 2×2 placement instead of in-furrow?
The thresholds in this calculator are calibrated for in-furrow, direct seed-contact scenarios. For 2×2 placement, actual safe rates are substantially higher because the fertilizer is not in direct contact with the seed. Using this tool for 2×2 evaluation will produce conservative, risk-underestimating results. The practical guidance is that most agronomists consider 2×2 placement to allow roughly 30-40% higher N+K loads before phytotoxicity risk becomes significant.
What is plasmolysis and how does it kill seedlings?
Plasmolysis occurs when the solution surrounding a plant cell has a higher solute concentration than the cell’s interior. Osmosis drives water out of the cell to equalize the concentration gradient. In a germinating seed, this process causes cellular dehydration, membrane collapse, and irreversible damage to the embryo. The seed may absorb enough moisture to initiate germination but then lose water to the surrounding fertilizer solution before it can establish a root system.
Is a low salt index score always safe for in-furrow use?
No. This is one of the most consequential misunderstandings in in-furrow fertilizer planning. A low salt index score describes the osmotic activity per unit of the fertilizer product. If that product is applied at a high rate, the total delivered salt load can still exceed safe thresholds. 10-34-0 with a salt index of 16.9 is a Danger-level input at 5 gal/acre on sandy soil with soybeans. Rate, soil texture, and crop sensitivity all determine actual risk alongside the score.
Conclusion
The practical value of a fertilizer salt index calculator is not in the score it produces; it is in the rate adjustment that score forces before the planter leaves the shed. Plasmolysis-related stand failure is one of the most financially damaging agronomic mistakes a grower can make because it is invisible until it is irreversible. Emergence is patchy, the stand count is permanently reduced, and replanting decisions carry their own penalties. Calculating the salt load of your in-furrow program before planting costs nothing and prevents a loss that no post-emergence input can recover.
The single most common error in this category is assuming that a low-index fertilizer product is unconditionally safe at any rate on any soil for any crop. That assumption fails on sandy soils with sensitive crops, under dry conditions, and whenever a secondary potassium source is blended into the tank without recalculation. Growers using the soil pH lime calculator and similar planning tools to build a complete pre-plant program should treat this salt index check as a required step in that workflow, not an optional refinement.
Lead Data Architect
Umer Hayiat
Founder & Lead Data Architect at TheYieldGrid. I bridge the gap between complex agronomic data and practical growing, transforming verified agricultural science into accessible, mathematically precise tools and guides for serious growers.
View all tools & guides by Umer Hayiat →