
Every soil test reports a number that most fertilizer programs ignore: the soil organic matter percentage. Behind that number sits a biological nitrogen reserve that releases plant-available N every growing season through microbial decomposition. The size of that release depends on three variables: how much organic matter is present, how deep the sampled soil layer is, and how active the microbial community will be under your expected climate and tillage conditions. The math connecting those three variables is straightforward, but it is almost never run at the field level.
This tool calculates the pounds of nitrogen per acre that microbial mineralization of soil organic matter is likely to release in a single growing season. It does not predict crop uptake, account for nitrogen losses through leaching or denitrification, or replace a certified crop advisor’s fertilizer recommendation. The calculation reflects what the soil can supply from its organic pool under your specified conditions; what the crop actually captures depends on root development, soil temperature timing, and dozens of other factors outside this model’s scope.
Bottom line: After running the calculator, you have a documented nitrogen credit to weigh against your planned synthetic fertilizer rate. That credit may be small enough to ignore or large enough to justify a material rate reduction, and this tool tells you which situation applies to your field.
Use the Tool
SOM Nitrogen Mineralization Calculator
Estimate your soil’s hidden biological nitrogen bank & seasonal release — soil organic matter nitrogen release
| SOM % | SOM (lbs/acre) | Organic N Pool (lbs) | Mineralized N/yr (lbs) | Rating |
|---|
Seed Blends
Inoculants (Mycorrhizae/Bacillus)
& Low-Till Tools
Loggers (IoT)
How This Calculator Works — Formula Transparency
This tool estimates the seasonal plant-available nitrogen released from your soil’s organic matter through microbial mineralization. Here’s each step:
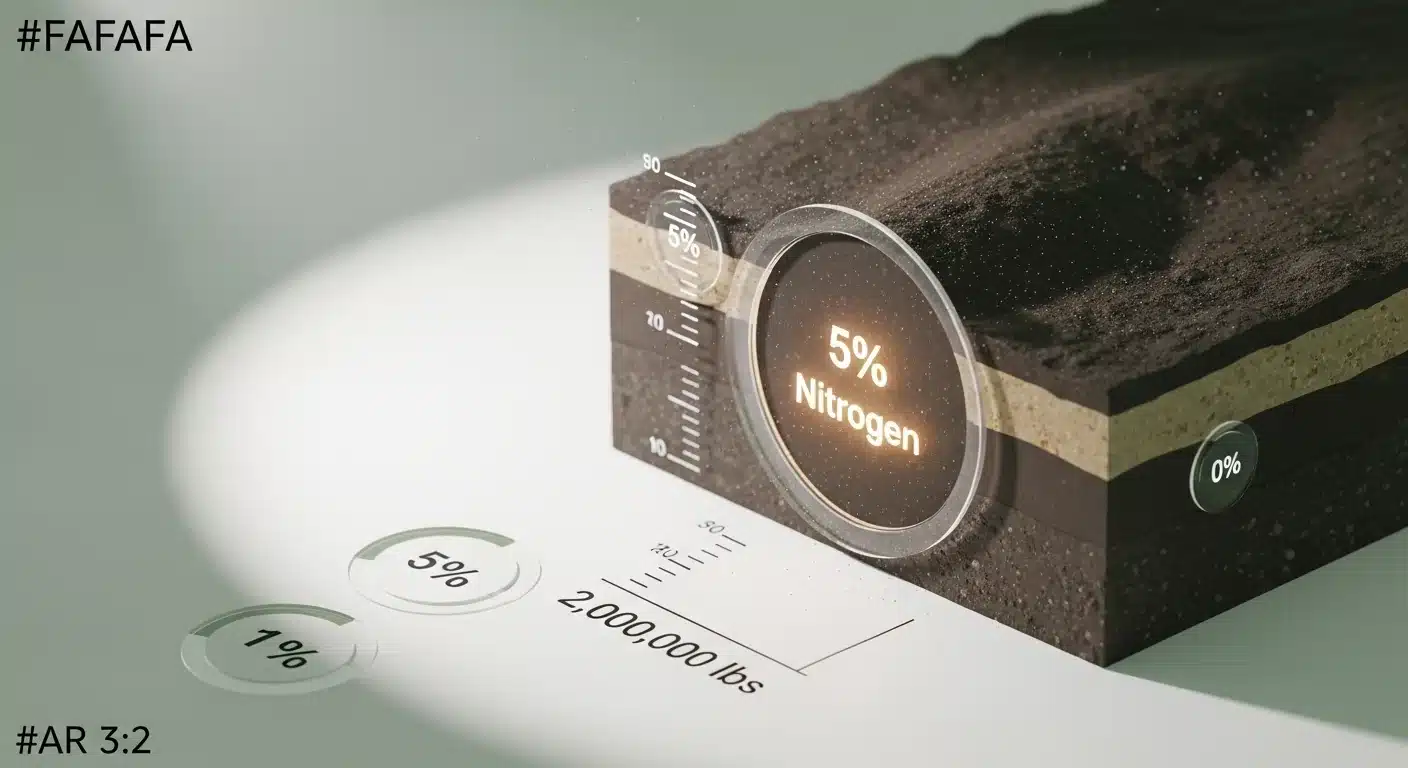
A 6″ furrow slice of typical mineral soil weighs approximately 2,000,000 lbs/acre. For other depths, this scales proportionally:
Soil Weight = 2,000,000 × (Depth ÷ 6) lbs/acre
Multiply soil weight by your lab-reported SOM fraction:
SOM (lbs/acre) = Soil Weight × (SOM% ÷ 100)
Soil organic matter is approximately 5% nitrogen by mass (C:N ratio ~20:1):
Total Organic N = SOM (lbs) × 0.05
Microbes decompose and release nitrogen at a rate that varies with temperature, moisture, and tillage. Apply the selected mineralization rate:
Mineralized N = Total Organic N × Mineralization Rate
Rates: Low=0.8% Moderate=1.5% High=2.2% Very High=3.0% per season
Assumptions & Constants: 2,000,000 lbs soil/acre/6″ depth; SOM N content = 5%; single-season release only; no account for nutrient uptake timing or leaching losses.
Assumptions & Limits of This Tool
This calculator is an agronomic estimate — not a substitute for a certified soil test or crop nutrition plan. Results reflect average mineralization in a single growing season under the selected microbial conditions.
Key assumptions:
• SOM bulk density: 2,000,000 lbs/acre for a 6-inch furrow slice (standard agronomy convention for non-organic soils).
• Nitrogen content of SOM: 5% (C:N ratio ≈ 20:1, universally used for mineral soils).
• Mineralization rates: Low 0.8%, Moderate 1.5%, High 2.2%, Very High 3.0% per season — derived from USDA SARE and university extension research averages.
• Model does not account for: N immobilization, leaching, denitrification, compaction, drainage class, pH, sand/clay content, or specific crop uptake timing.
Not suitable for: organic soils (muck/peat, SOM >15%), compacted soils, flooded paddies, highly eroded soils, or subsoil layers below 12 inches.
Always pair with: complete soil test (N, P, K, pH, CEC), state university fertilizer recommendations, and on-farm trial data before adjusting your N fertilizer program.
[put the tool here]
Before entering values, have your most recent soil test report on hand. You will need the reported Soil Organic Matter percentage (sometimes labeled as “OM%”), the depth at which the sample was collected (standard agronomic convention is a 6-inch furrow slice), and a working understanding of your tillage system and local climate. Fields under no-till management with active cover crop rotations typically support higher microbial activity than conventionally tilled fields. If you are also tracking your overall nitrogen budget across synthetic and organic sources, the nitrogen calculator provides a complementary view for balancing total program rates.
Quick Start (60 Seconds)
- SOM %: Pull this directly from your lab report. Enter it as a decimal number (for example, 3.5 for 3.5%). Do not convert to a fraction; the tool handles the division. Values above 10% likely indicate organic or muck soils where this model’s soil weight assumptions break down.
- Topsoil Depth: Most labs sample to 6 inches. If your report specifies a different depth (8 inches is common for some row crop conventions), enter that number. The depth directly scales the calculated soil weight, so using 6 when the actual sample was 8 inches will understate your N pool by roughly 33%.
- Microbial Activity Level: Select the option that best matches your field conditions for the upcoming season. “Moderate” (temperate climate, reduced tillage, average moisture) is the standard agronomic default used in most university extension estimates. Select “Low” for cold-climate fields or heavily tilled fields with minimal residue. Select “High” or “Very High” only if conditions genuinely support elevated biological activity year-round.
- Check your units: SOM is entered as a percentage, not a decimal fraction. Depth is in inches, not centimeters.
- Do not average across fields: Run each field or management zone separately. A field averaging 3.5% SOM across two zones at 2% and 5% will produce a very different mineralization picture than the blended number suggests.
Inputs and Outputs (What Each Field Means)
| Field Name | Unit | What It Means | Common Entry Mistake | Safe Entry Guidance |
|---|---|---|---|---|
| Soil Organic Matter (SOM) % | % (percent of soil weight) | The fraction of soil mass composed of living organisms, decomposing residues, and stabilized humus, as reported by a standard laboratory loss-on-ignition or Walkley-Black test. | Entering the value as a decimal (0.035 instead of 3.5) | Accepted range: 0.1 to 20. Organic soils with values above 12 should use an organic-soil-specific model. |
| Topsoil Depth | inches | The depth of the soil layer represented by the SOM reading. Standard agronomic furrow-slice depth is 6 inches. Some labs composite to 8 inches for no-till fields. | Leaving this at the default 6 inches when the lab sampled to a different depth | Check your soil test report header for the stated sampling depth. Accepted range: 1 to 24 inches. |
| Expected Microbial Activity | Categorical (maps to a mineralization rate) | A proxy for the fraction of the organic nitrogen pool that soil microbes convert to plant-available nitrate and ammonium in a single growing season. Driven by soil temperature, moisture, tillage disturbance, and biological inputs. | Selecting “Very High” based on optimism rather than actual field conditions | Use “Moderate” as the default unless you have soil temperature data and a documented history of no-till plus cover cropping. |
| Mineralized N (Primary Output) | lbs N per acre | Estimated plant-available nitrogen released from the SOM pool this season through microbial decomposition. | Treating this as total available N rather than as a partial credit alongside residual soil nitrate and fertilizer N | Always add this credit to a full soil nitrate test result, not use it as a standalone fertility estimate. |
| SOM (lbs/acre) | lbs per acre | Total pounds of organic matter in the top soil layer per acre, derived from soil weight and SOM percentage. | Not applicable (calculated field) | Reference value only; useful for understanding the scale of the biological reserve. |
| Total Organic N Pool | lbs per acre | The total nitrogen stored in the organic matter pool, calculated at a 5% N content of SOM (reflecting a carbon-to-nitrogen ratio of approximately 20:1). | Confusing this with the mineralized N output; the pool is locked, only a fraction is released each season | Reference value only. Understanding the carbon-to-nitrogen ratio of your inputs helps explain why the release fraction varies by organic source. |
| Saved $/acre | dollars per acre | Estimated economic value of the mineralized N credit at $0.60 per pound of synthetic nitrogen. This is a reference price; adjust the calculation manually for your actual input cost. | Using this figure in a formal budget without updating for current fertilizer prices | Treat as directional only. Synthetic N prices vary significantly by region and season. |
Worked Examples (Real Numbers)
Example 1: Average Midwest Corn Field, Moderate Management
- SOM: 2.5%
- Topsoil depth: 6 inches
- Microbial activity: Moderate (1.5% per season)
Soil weight: 2,000,000 lbs/acre. SOM pool: 2,000,000 x 0.025 = 50,000 lbs/acre. Organic N pool: 50,000 x 0.05 = 2,500 lbs/acre. Mineralized N: 2,500 x 0.015 = 37.5 lbs/acre.
Result: 38 lbs N per acre (rounded to nearest whole pound).
This field’s soil provides a meaningful nitrogen credit, exceeding the practical 30 lb/acre threshold. A grower applying 180 lbs N/acre synthetically could evaluate a 35-38 lb reduction in pre-plant N application with confidence, substituting in-season side-dress to verify status at V6.
Example 2: High-Organic No-Till Field With Active Cover Crops
- SOM: 5.0%
- Topsoil depth: 6 inches
- Microbial activity: High (2.2% per season)
Soil weight: 2,000,000 lbs/acre. SOM pool: 2,000,000 x 0.05 = 100,000 lbs/acre. Organic N pool: 100,000 x 0.05 = 5,000 lbs/acre. Mineralized N: 5,000 x 0.022 = 110 lbs/acre.
Result: 110 lbs N per acre.
At this level, the soil is supplying more than half the nitrogen requirement for a 200 bu/acre corn crop. A pre-plant synthetic N application of 60-80 lbs/acre paired with a side-dress decision tool at V6 is a reasonable starting framework, though tissue testing remains essential before cutting rates significantly below historical norms.
Example 3: Low-SOM Dryland Field, Deep Sampling, Cold Climate
- SOM: 1.0%
- Topsoil depth: 8 inches
- Microbial activity: Low (0.8% per season)
Soil weight: 2,000,000 x (8 / 6) = 2,666,667 lbs/acre. SOM pool: 2,666,667 x 0.01 = 26,667 lbs/acre. Organic N pool: 26,667 x 0.05 = 1,333 lbs/acre. Mineralized N: 1,333 x 0.008 = 10.7 lbs/acre, rounded to 11 lbs/acre.
Result: 11 lbs N per acre.
This result falls well below the 30 lb/acre practical threshold. No meaningful credit should be applied against the synthetic nitrogen program. The primary agronomic priority for this field is building SOM through extended crop rotations and cover crop establishment before expecting biological nitrogen to contribute materially.
Reference Table (Fast Lookup)
All values below assume a 6-inch sampling depth and Moderate microbial activity (1.5% per season). The economic value column uses $0.60 per pound of synthetic nitrogen as a reference price.
| SOM (%) | SOM Pool (lbs/acre) | Organic N Pool (lbs/acre) | Mineralized N/Season (lbs/acre) | Economic Value at $0.60/lb N | N Credit Rating |
|---|---|---|---|---|---|
| 0.5 | 10,000 | 500 | 7.5 | $4.50 | Very Low (no credit) |
| 1.0 | 20,000 | 1,000 | 15 | $9.00 | Low (no credit) |
| 1.5 | 30,000 | 1,500 | 22.5 | $13.50 | Below Average (marginal) |
| 2.0 | 40,000 | 2,000 | 30 | $18.00 | At Threshold (credit applicable) |
| 2.5 | 50,000 | 2,500 | 37.5 | $22.50 | Average (solid credit) |
| 3.5 | 70,000 | 3,500 | 52.5 | $31.50 | Good (strong credit) |
| 5.0 | 100,000 | 5,000 | 75 | $45.00 | High (significant reduction possible) |
| 7.0 | 140,000 | 7,000 | 105 | $63.00 | Very High (verify with tissue test) |
| 10.0 | 200,000 | 10,000 | 150 | $90.00 | Exceptional (check for organic soil class) |
How the Calculation Works (Formula and Assumptions)

Show the calculation steps
Step 1: Establish soil weight per acre. The standard agronomic furrow-slice convention assigns approximately 2,000,000 pounds of mineral soil per acre to a 6-inch depth. This is a widely accepted approximation based on typical bulk densities of 1.3 to 1.5 g/cm3. For depths other than 6 inches, the weight scales proportionally:
Soil Weight (lbs/acre) = 2,000,000 x (Depth in inches / 6)
Step 2: Calculate the SOM pool. Multiply the soil weight by the SOM percentage expressed as a decimal:
SOM Pool (lbs/acre) = Soil Weight x (SOM% / 100)
Step 3: Calculate total organic nitrogen. Soil organic matter contains approximately 5% nitrogen by weight, which corresponds to a carbon-to-nitrogen ratio of roughly 20:1. This is the consensus value used across USDA SARE literature, university extension guidelines, and peer-reviewed agronomy references:
Total Organic N (lbs/acre) = SOM Pool x 0.05
Step 4: Apply the mineralization rate. Only a fraction of the total organic N pool becomes plant-available in a single season. The rate depends on microbial population activity, which is driven by soil temperature, moisture availability, and tillage disturbance. The four rates used in this tool are:
- Low (cold, conventional-till): 0.8% per season
- Moderate (temperate, reduced-till): 1.5% per season
- High (warm-moist, no-till with cover crops): 2.2% per season
- Very High (tropical, irrigated, biologically stimulated): 3.0% per season
Mineralized N (lbs/acre) = Total Organic N x Mineralization Rate
Rounding rule: All final outputs are rounded to the nearest whole pound. Intermediate values retain full decimal precision during calculation.
Assumptions and Limits
- The 2,000,000 lbs/acre soil weight constant assumes a bulk density appropriate for mineral soils. Organic soils (SOM above 12%), compacted soils, and very coarse sandy soils may deviate significantly from this assumption.
- The 5% nitrogen content of SOM reflects the long-term average C:N ratio of stabilized humus. Fresh residues and green manures have variable C:N ratios and will not behave as this model predicts in the short term.
- Mineralization rates (0.8% to 3.0%) are seasonal averages derived from temperate and tropical agronomic research. Actual in-season rates vary week by week as soil temperature and moisture fluctuate.
- The model does not account for nitrogen immobilization (temporary N tie-up when high C:N residues decompose), denitrification losses under saturated conditions, or leaching in sandy or high-rainfall environments.
- Results apply to the growing season only. The model does not differentiate between a 90-day and a 180-day season.
- Lab method matters: loss-on-ignition (LOI) and Walkley-Black SOM measurements are not directly interchangeable and can differ by 10 to 30 percent. Confirm which method your lab used before comparing results across labs or years.
- This calculator should not be the sole basis for reducing synthetic fertilizer rates on new fields, high-yield environments, or fields with no history of SOM-credited nitrogen programs.
Standards, Safety Checks, and “Secret Sauce” Warnings
Critical Warnings
- The hidden double-payment trap: A field at 4% SOM contains roughly 4,000 pounds of organic nitrogen per acre at the standard 5% N-content ratio. If that soil is under Moderate microbial activity, it releases approximately 60 lbs N/acre this season without any fertilizer application. Applying a full 200 lb/acre synthetic nitrogen program without crediting this release means paying for 60 lbs of nitrogen the soil was already going to supply. This is not a minor rounding error; at current nitrogen prices it represents a material per-acre cost that compounds across every field where high-SOM soil is managed with a low-SOM fertilizer template.
- The below-threshold rule: When the calculated mineralized N falls below 30 lbs/acre, the biological supply is not large enough to justify any adjustment to a conventional fertilizer program. Fields at 1% SOM under cold, tilled conditions may release fewer than 12 lbs N/acre. Reducing synthetic inputs based on that figure would create a real yield-limiting nitrogen deficit. The 30 lb/acre threshold is the practical floor for crediting this calculator’s output against a fertilizer program.
- Organic soil warning: Fields with SOM readings above 10 to 12 percent are likely approaching organic soil classification (muck or peat). The 2,000,000 lb/acre bulk density assumption significantly overstates soil weight for these soils, inflating both the SOM pool and the mineralized N estimate. A separate organic-soil nitrogen release model is required for those fields.
- Sampling depth mismatch: If your soil test report does not clearly state the sampling depth, assume 6 inches and flag the data for re-verification. Inputting 6 inches when the actual sample was collected to 8 inches understates the soil weight by 33%, which flows directly into an understated nitrogen release estimate.
Minimum Standards for Applying This Credit
- Use a soil test collected within the past two years. SOM changes slowly (typically less than 0.1% per year under most management systems), but significant tillage changes, cover cropping, or manure applications can shift the SOM trajectory enough to warrant fresher data.
- Pair the mineralized N credit with a pre-plant or early-season soil nitrate test. Organic N release is predicted, but residual nitrate from previous-season under-removal is measured. The manure nitrogen availability calculator is a useful companion for fields that also received organic amendments in recent seasons.
- Verify cation exchange capacity on high-SOM soils. High-SOM soils often have elevated CEC, which affects fertilizer efficiency and the timing of ammonium availability. The CEC soil calculator can help contextualize how the soil’s buffering capacity interacts with biological nitrogen release.
- Apply the credit conservatively in the first year. Use 70 to 80 percent of the calculated mineralized N as your credited reduction while you establish a baseline for actual yield response in your specific fields.
Competitor Trap: Most online SOM nitrogen calculators display a single mineralized N number without flagging whether that number exceeds the practical credit threshold or whether the soil falls into an organic-soil category where the assumptions break down. A calculator that returns “60 lbs N/acre” without also communicating “this field is above the threshold and qualifies for a documented credit” versus “this field is below threshold and you should not adjust inputs” is providing a number, not a decision. The warnings and threshold logic built into this tool are what separates a useful agronomic tool from a number generator.
Common Mistakes and Fixes
Mistake: Using a Multi-Year Average SOM Instead of the Current Test Result
Some growers and advisors compute an average SOM from three or five years of lab data and use that blended number in nitrogen calculations. If SOM has been rising under a no-till and cover crop system, the average will understate the current organic N pool. If SOM is declining under intensive tillage, the average will overstate it. The biological N release happening this season is determined by what is in the soil right now, not what was there two or three years ago.
Fix: Always use the most recent soil test SOM value. If you have tests from multiple depths or management zones, run the calculator separately for each zone rather than averaging.
Mistake: Treating Mineralized N as Total Available N
The output of this calculator is the estimated contribution from the organic matter pool only. Residual inorganic nitrogen from previous fertilizer applications, legume credits, and nitrate carried over from the previous season all add to plant-available N but are outside this calculation’s scope. Adding only the SOM-derived N to a low synthetic N application and expecting full crop sufficiency is one of the most common errors in simplified nitrogen planning.
Fix: Use this result as one input line in a complete nutrient balance, alongside soil nitrate test results and any documented legume or manure credits. Knowing your full NPK picture starts with the NPK calculator to contextualize all nitrogen sources together.
Mistake: Selecting “High” or “Very High” Microbial Activity Without Documented Field Conditions
The difference between the Moderate and Very High activity rates is nearly double the mineralized N output. A grower with a 3% SOM field might see 45 lbs/acre under Moderate activity and 90 lbs/acre under Very High, a swing large enough to completely reframe a fertilizer program. Selecting Very High based on optimism rather than documented soil temperature, cover crop history, and biological input records creates a false credit that leads to under-fertilization.
Fix: Default to Moderate for any field without a documented multi-year no-till and cover crop history with warm-season growing conditions. Upgrade the activity level only after in-season tissue tests confirm that biological N supply is actually occurring at the higher rate.
Mistake: Ignoring the Sampling Depth Field
A 6-inch and 8-inch sample from the same field produce meaningfully different soil weights. Entering 6 inches for a soil test collected to 8 inches underestimates the SOM pool by 33 percent, which produces a proportionally understated N release estimate. This is a structural error in the input data, not a rounding issue, and it cannot be corrected by adjusting other variables.
Fix: Check the soil test report header before entering a depth value. If the sampling depth is not stated on the report, contact your lab for clarification before running the calculator. The understanding of how nitrogen loss mechanisms interact with application depth also reinforces why input accuracy at the top of the model matters throughout.
Mistake: Applying the Credit on Fields With No SOM-Calibrated Yield History
The mineralized N estimate from a calculator is a prediction based on population-level averages for microbial activity rates and SOM nitrogen content. Fields with unusual soil biology, recent fumigation history, waterlogging events, or extreme pH conditions may behave differently from the model’s assumptions. Cutting synthetic N rates on a high-value field without a buffer or a split-application plan introduces yield risk that the calculator cannot quantify.
Fix: Build your field history of SOM-credited reductions progressively over two to three seasons, starting with a 75-percent credit applied to one split-application portion rather than a full pre-plant reduction. This preserves the ability to correct course based on in-season plant response.
Next Steps in Your Workflow

Once you have the calculator’s output, the practical next move depends on where the mineralized N result falls relative to the 30 lb/acre threshold. Fields above that threshold have a documentable nitrogen credit that can inform a formal adjustment to your fertilizer program; fields below it return to a conventional synthetic-only planning frame. For fields with significant credit, the calculation feeds into split-application planning rather than a flat pre-plant reduction. A nitrogen credit of 40 to 80 lbs/acre applied pre-plant is not as economically useful as identifying that credit and reallocating that portion of your nitrogen to a responsive side-dress application timed to crop demand at V4 to V6. If your fields also receive biological inoculants or cover crop seed blends that influence nitrogen fixation and soil biology, reviewing recommended seed inoculant application rates ensures that any biological investment is calibrated correctly alongside your organic N release projections.
Building SOM is the only way to increase the biological nitrogen bank over time. Compost, cover crops, and reduced tillage all contribute, but the agronomic math of how fast SOM builds and what volume of amendment is required to move the needle is often underestimated. Organic matter accumulates slowly, typically 0.1% per year under favorable management, and is rapidly depleted under intensive tillage. If you are planning a compost or amendment program to build SOM, running your volume estimates through a compost calculator before purchasing inputs confirms whether your amendment rate is realistically proportional to the SOM gain you are expecting over your planning horizon.
FAQ
What is a realistic nitrogen credit from soil organic matter for a typical Midwest field?
A field at 2.5% SOM under Moderate microbial activity releases approximately 37 to 38 pounds of nitrogen per acre per season using the standard 6-inch furrow-slice convention. This is enough to justify a documented credit but not enough to support a wholesale elimination of synthetic nitrogen inputs. Most well-managed Midwest fields with SOM between 2 and 3.5 percent fall in the 30 to 55 lb/acre range under moderate conditions.
Why does topsoil depth matter so much in this calculation?
The soil weight used in the calculation scales linearly with depth. A 6-inch sample corresponds to approximately 2,000,000 pounds of soil per acre; an 8-inch sample corresponds to about 2,666,667 pounds. Since the SOM pool and its nitrogen content are both derived from soil weight, an incorrect depth entry propagates through all downstream results. A 2-inch depth error can shift the final mineralized N estimate by 25 to 33 percent.
Can I use this calculator for organic or muck soils?
The model uses a mineral-soil bulk density assumption of approximately 2,000,000 pounds per acre per 6-inch depth. Organic soils, which are defined by SOM levels above roughly 20 percent and specialized peat or muck taxonomy, have substantially lower bulk densities. Applying this calculator to organic soils will produce a significant overestimate of the SOM pool and therefore the mineralized nitrogen. Use a soil-class-specific organic N release model for those fields.
Is the 5% nitrogen content of SOM always accurate?
The 5% figure reflects the long-term average nitrogen content of stabilized humus in mineral soils, corresponding to a carbon-to-nitrogen ratio of approximately 20:1. It is a widely accepted agronomic approximation, not a precisely measured constant for any individual field. Soils with very recent high-residue additions (fresh corn stover, sawdust) may have higher C:N ratios in the active fraction, meaning the effective nitrogen contribution is temporarily lower while decomposition catches up. Soils with sustained legume and manure management may trend slightly higher in N content.
How often should I rerun this calculation?
Rerun the calculation whenever you receive a new soil test with an updated SOM reading or when your management practices change significantly. A shift from conventional tillage to no-till, adoption of a multi-species cover crop rotation, or a change in your manure or compost application rate can all move SOM on a 2 to 5 year timeline. Reviewing the calculation annually at the start of each planning cycle keeps the estimate current with your actual field conditions.
Does the calculator account for nitrogen release from crop residues decomposing this season?
No. The model calculates nitrogen release from the stable SOM pool only. Nitrogen released from the current season’s decomposing crop residues is a separate flux that depends on the residue’s carbon-to-nitrogen ratio, the decomposition rate under local temperature and moisture, and the timing relative to crop uptake. For legume residues or high-quality green manures, that additional N supply can be substantial and should be estimated separately using a residue decomposition model or university extension tables.
Conclusion
Soil organic matter is the most consistently undervalued input in nitrogen management. The biological N release it generates is real, calculable, and directly reducible to an economic value, but capturing that value requires running the math instead of applying a blanket fertilizer rate calibrated for a different field or a different decade. This calculator provides a structured way to quantify the mineralization credit specific to your SOM level, sampling depth, and expected microbial activity, and to flag when that credit is large enough to justify a program adjustment versus when it falls below the threshold where any reduction would introduce yield risk.
The most important mistake to avoid is using the output number without checking it against the 30 lb/acre practical threshold. A result of 12 lbs/acre and a result of 75 lbs/acre call for entirely different management responses, and both are possible from the same tool depending on the inputs. The threshold check is what turns a calculation into a decision. For growers already tracking their complete nitrogen budget, the NPK fertilizer calculator provides a logical next step for integrating the SOM-derived credit into a full nutrient planning document alongside synthetic, organic, and residual nitrogen sources.
Lead Data Architect
Umer Hayiat
Founder & Lead Data Architect at TheYieldGrid. I bridge the gap between complex agronomic data and practical growing, transforming verified agricultural science into accessible, mathematically precise tools and guides for serious growers.
View all tools & guides by Umer Hayiat →