Most gardeners treat the first frost date as a single fixed date on the calendar, something to look up and then act on instinctively. That framing skips the more useful question: given the specific crops you still have in the ground or plan to start, do you have enough days left to reach harvest before the killing frost arrives? The difference between those two questions is the difference between planning and guessing.
This first frost date calculator takes your ZIP code and today’s date, maps them to USDA Hardiness Zone historical frost averages from NOAA’s 30-year climate normals, and returns a precise countdown in days alongside a risk classification. It then cross-references that countdown against the days-to-maturity for 18 common crops to give a binary “safe to plant” decision for each. It does not generate weather forecasts, it does not account for microclimates, and it does not override local agricultural extension guidance. Frost dates are probability windows derived from historical data, not guarantees. Understanding the dew point conditions in your growing environment adds a second layer of precision, since frost forms when surface temperatures drop to the dew point under clear, calm skies.
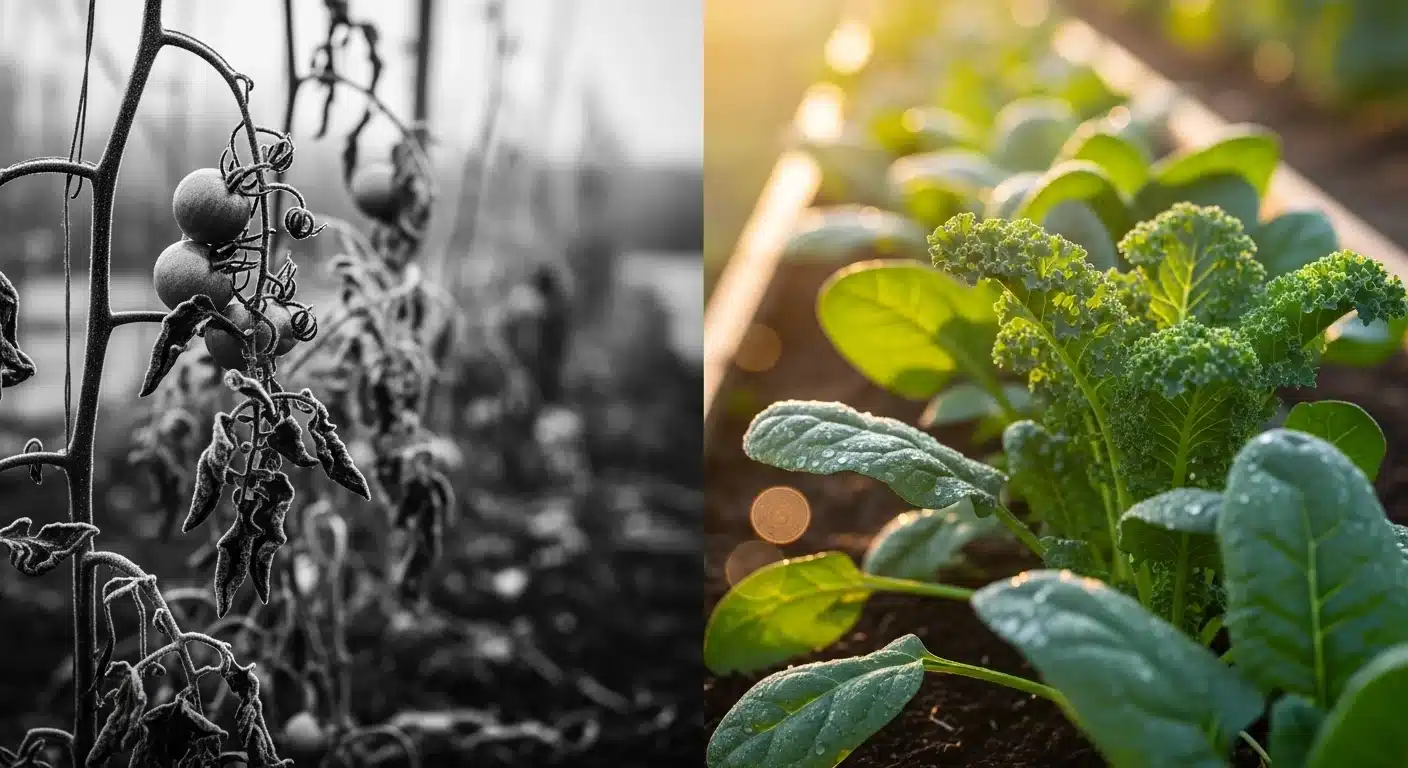
After running this calculator, you will know which crops can realistically reach maturity before your first frost, which ones might finish with row cover assistance, and which ones should not be started from seed at all this season.
Use the Tool
Frost Date Countdown Calculator
First Frost Date Calculator — The Yield Grid
How This Calculator Works
Formula: Days Remaining to First Frost
• Low risk: >60 days remaining
• Medium risk: 21–60 days remaining
• High risk: ≤20 days remaining
Assumptions & Limits
Frost dates are historical 30% probability averages per NOAA/USDA data — actual frost may occur earlier or later. Zone lookup is approximated from ZIP code prefix regions. Always monitor local weather forecasts. Row cover gains assume lightweight spunbond fabric (1.5 oz/yd²) providing +2–4°F protection.
Assumptions & Limits
Data Source: Frost dates are estimated from NOAA 1991–2020 climate normals and USDA Plant Hardiness Zone map (30-year averages). Values represent the 30% probability of first fall frost occurrence.
Zone Lookup: This tool approximates USDA zone from the first 3 digits of the ZIP code (ZIP prefix regions). For precise zone data, verify at planthardiness.ars.usda.gov.
Crop Days to Maturity: Values represent days from transplant or direct sow to harvest-ready stage under typical growing conditions. Actual maturity may vary with temperature, variety, and soil conditions.
Row Cover Gains: Season extension assumes lightweight horticultural fleece (1–1.5 oz/yd²). Heavier covers (2 oz+) may add up to 28 days. Ventilation and soil moisture management are still required.
Not a substitute for: Local agricultural extension office guidance, real-time weather forecasting, or certified crop insurance advice.
Before calculating, have your ZIP code ready. The tool approximates your USDA Hardiness Zone from the first two to three digits of the ZIP, so a full 5-digit code gives the best regional match. The current date is auto-filled to today, but you can override it to model a future planting decision. If you’re planning a late-season crop rotation, the crop steering calculator pairs naturally with this tool to plan irrigation and nutrient drawdown timing as harvest approaches.
Quick Start (60 Seconds)
- ZIP Code field: Enter your 5-digit US ZIP code. The tool reads the first 2-3 digits to identify your climate region. Do not enter a Canadian postal code or USDA zone number directly; the field expects numeric ZIP input only.
- Current Date field: Pre-filled to today. Change it if you are modeling a hypothetical future planting date, such as “If I start seeds on October 1st, will cucumbers finish?”
- Days remaining output: This is the core number. Read it before scanning the crop table.
- Risk badge: Low (over 60 days), Moderate (21-60 days), High (20 days or fewer). High risk means only cold-tolerant crops should be considered.
- Crop table status column: “Safe” means days remaining exceeds that crop’s full maturity window. “Too Late” means it does not. “With Row Cover” means the crop could finish if you add row cover protection immediately.
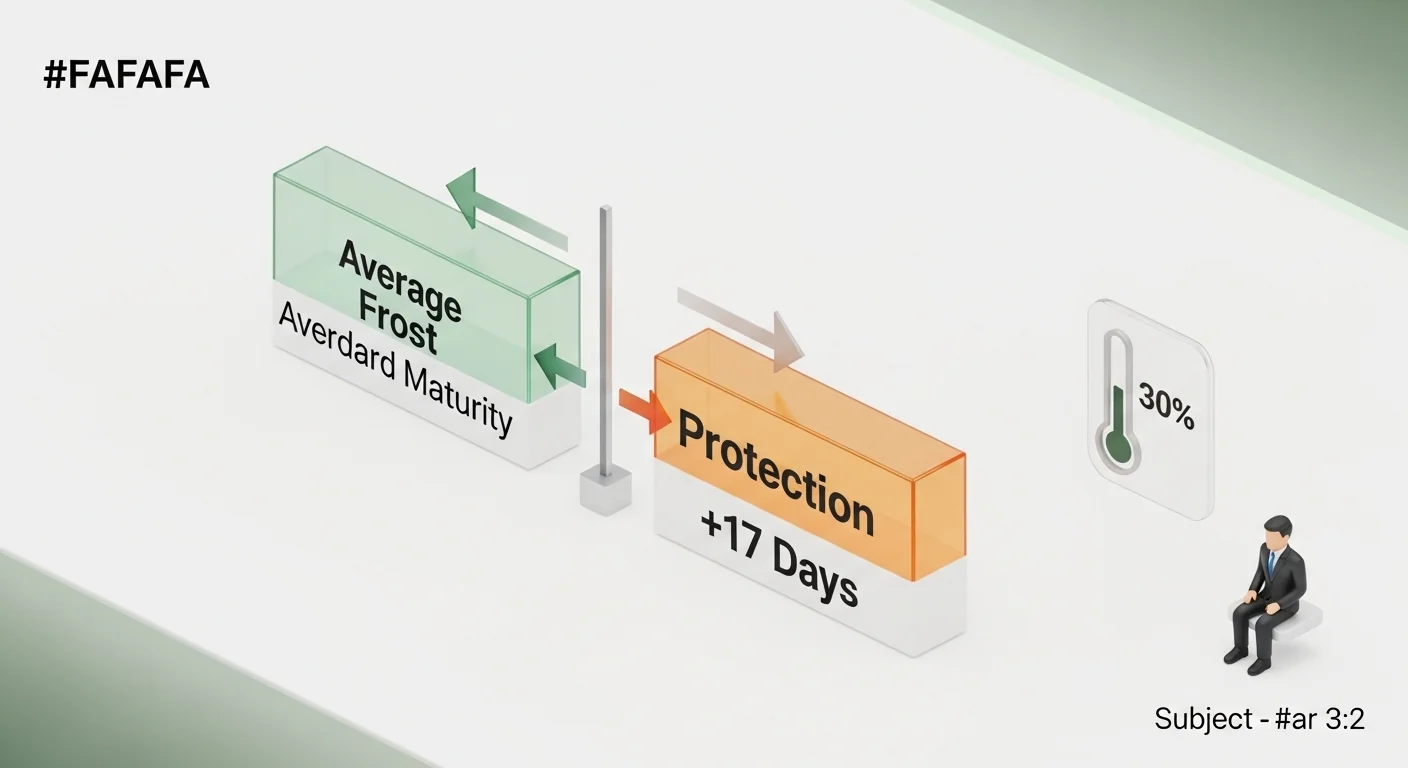
- Row cover extender box: Shows how many additional days (+14 to +21, average +17) are gained with lightweight horticultural fabric. This shifts borderline crops from “Too Late” to possible.
- Reset button: Clears all outputs and restores today’s date. Use it to model a second scenario without leftover results from the first run.
Inputs and Outputs (What Each Field Means)
| Field | Unit / Type | What It Means | Common Mistake | Safe Entry Guidance |
|---|---|---|---|---|
| ZIP Code | 5-digit numeric text | Locates your USDA climate zone and maps it to a historical average first frost date for your region | Entering only 3 digits or a non-US code, which returns no match | Use the full 5-digit ZIP of your growing site, not a nearby city if you are in a rural frost pocket |
| Current Date | Calendar date (YYYY-MM-DD) | The reference point from which days remaining is counted; auto-filled to today | Forgetting to update this field when modeling a future scenario, which produces stale results | Leave as-is for today’s calculation; change deliberately when running “what if” scenarios |
| Days Until First Frost (output) | Integer days | Calendar days between the entered date and the estimated first frost date for the detected zone | Treating this as an exact forecast rather than a historical average with variability | Cross-reference with your local extension office’s frost probability tables for higher-stakes decisions |
| Risk Level (output) | Low / Moderate / High | Classification based on days remaining: over 60 = Low, 21-60 = Moderate, 20 or fewer = High | Ignoring “Moderate” and treating it as safe for all crops regardless of days to maturity | Always check the individual crop rows; “Moderate” can still mean pumpkins are off the table |
| Estimated Frost Date (output) | Calendar date | The historical average date when the first frost (28-32 degrees F) typically occurs in the detected zone | Assuming this is the 50th percentile date; this tool uses the 30th percentile (more conservative) | Note whether the zone is a warm or cold microclimate; adjust expectations accordingly |
| USDA Zone (output) | Zone label (e.g., 5b) | The USDA Plant Hardiness Zone associated with the ZIP prefix used for frost date lookup | Confusing hardiness zone with frost date precision; zones span wide temperature ranges | Verify your zone at planthardiness.ars.usda.gov if your site has unusual elevation or water proximity |
| Crop Safety Table (output) | Safe / Too Late / With Row Cover | Each crop’s “days to maturity” compared against days remaining, with and without row cover extension | Assuming “Safe” means the crop will definitely produce; it means the calendar window is sufficient | Use “With Row Cover” status only if you will actually deploy fabric; the protection gain requires action |
| Row Cover Extension (output) | Days (average +17, range +14 to +21) | Estimated season extension from lightweight spunbond horticultural fleece (1-1.5 oz per square yard) | Applying heavy garden fabric without ventilation, which can overheat crops during warm fall days | Vent covers on sunny afternoons; the protection is overnight temperature maintenance, not a tent |
Worked Examples (Real Numbers)
Example 1: Denver, Colorado (Late Summer Planting Decision)
- ZIP Code: 80202
- Detected Zone: 5b
- Estimated First Frost: October 10
- Current Date: August 15
Result: 56 days remaining. Moderate risk.
With 56 days left, pumpkins (90 days to maturity) and carrots (70 days) are off the table. Cucumbers (50 days), summer squash (50 days), and kale (40 days) fall within the window. Adding row cover raises the effective window to approximately 73 days, which keeps green beans (55 days) and broccoli (55 days) viable as well.
Example 2: Minneapolis, Minnesota (Late Season Assessment)
- ZIP Code: 55401
- Detected Zone: 4a
- Estimated First Frost: September 22
- Current Date: August 10
Result: 43 days remaining. Moderate risk.
A narrow window. Only the fastest crops pass without intervention: radishes (25 days), spinach (30 days), lettuce (35 days), and kale (40 days). With row cover the window extends to roughly 60 days, which opens green beans (55 days) and potentially broccoli (55 days) as borderline candidates. All warm-season crops are too late without greenhouse protection.
Example 3: Miami, Florida (Extended Season Opportunity)
- ZIP Code: 33101
- Detected Zone: 10a
- Estimated First Frost: January 15
- Current Date: October 1
Result: 106 days remaining. Low risk.
Virtually the entire crop list is viable, including pumpkins (90 days) and watermelon (80 days). The primary planning consideration shifts from frost avoidance to heat and humidity management through October before temperatures moderate. No row cover is needed for frost protection at this stage.
Reference Table (Fast Lookup)
This table shows USDA Hardiness Zone frost date estimates, approximate days remaining from two common planning reference dates, and the resulting risk classification. The “Crops Viable Without Row Cover” column is derived directly from the crop maturity database used in the calculator.
| USDA Zone | Avg First Frost | Days Remaining from Aug 1 | Days Remaining from Sep 1 | Risk Level (Sep 1) | Crops Viable Without Row Cover (Sep 1) |
|---|---|---|---|---|---|
| 4a | Sep 15-22 | 45-52 | 14-21 | High | Radishes, Spinach, Lettuce only |
| 4b | Sep 25-28 | 55-58 | 24-27 | Moderate-High | Radishes, Spinach, Lettuce, Kale |
| 5a | Oct 2-8 | 62-68 | 31-37 | Moderate | Above + Beets, Summer Squash, Cucumbers |
| 5b | Oct 10-18 | 70-78 | 39-47 | Moderate | Above + Green Beans, Broccoli, Cabbage |
| 6a | Oct 20-25 | 80-85 | 49-54 | Moderate-Low | Above + Tomatoes (65 days), Bell Peppers (68 days) |
| 6b | Oct 25-30 | 85-90 | 54-59 | Low | Above + Cantaloupe (70 days), Carrots (70 days) |
| 7a | Nov 1-8 | 92-99 | 61-68 | Low | Above + Sweet Corn (72 days) |
| 7b | Nov 12-18 | 103-109 | 72-78 | Low | Above + Butternut Squash (80 days), Watermelon (80 days) |
| 8a | Nov 20-25 | 111-116 | 80-85 | Low | Above + Pumpkins (90 days) |
| 9a-9b | Dec 5-10 | 126-131 | 95-100 | Very Low | All 18 crops in the table |
| 10a+ | Jan 15 or later | 167+ | 136+ | Very Low | All crops; heat tolerance becomes primary constraint |
How the Calculation Works (Formula + Assumptions)

Show the calculation steps
Step 1: Zone Resolution
The tool reads the first two to three digits of the entered ZIP code and matches them against a regional lookup table built from USDA Plant Hardiness Zone data and NOAA 1991-2020 30-year climate normals. This returns a zone label (e.g., “5b”) and an associated historical average first frost date (e.g., “Oct 15”).
Step 2: Days Remaining Calculation
Days Remaining = First Frost Date (this calendar year) minus Current Date, measured in whole calendar days. If the frost date for the current year has already passed at the time of calculation, the tool automatically uses the following year’s equivalent frost date.
Step 3: Risk Classification
The day count maps to three thresholds:
– Over 60 days: Low risk
– 21 to 60 days: Moderate risk
– 20 days or fewer: High risk
Step 4: Crop Safety Assessment
For each of 18 crops, the tool compares Days Remaining against that crop’s days-to-maturity value. If Days Remaining is greater than or equal to the crop’s days to maturity, the crop is marked “Safe.” If not, it is “Too Late.”
Step 5: Row Cover Extension
Row cover adds an average of 17 days (range 14-21) to the effective growing window. The tool runs the same crop comparison using Days Remaining plus 17 to generate the “With Row Cover” column. A crop that fails the base check but passes the extended check is flagged as “With Row Cover.”
Rounding rules: Days remaining is rounded to the nearest whole day. The row cover midpoint of 17 days is used for the table comparison; the displayed range (14-21) is shown as context. No fractional days are presented.
Assumptions and Limits
- Frost dates represent the 30th percentile historical occurrence probability, meaning frost could arrive earlier in 3 out of 10 seasons historically.
- Zone lookup from ZIP prefix is an approximation. Urban heat islands, elevation differences, and proximity to large water bodies can shift effective frost dates by one to three weeks in either direction.
- Days to maturity values in the crop table reflect average conditions from transplant or direct sow under typical soil temperature and light conditions. Cool, cloudy falls will extend actual maturity timelines.
- Row cover gain of 14-21 days assumes lightweight spunbond horticultural fleece at 1.0-1.5 oz per square yard. Heavier covers (2 oz and above) can provide additional protection but require more careful ventilation management.
- The tool does not account for ground frost versus air frost. Soil can retain heat longer than air temperature indicates, or lose it faster in sandy, dry, or raised beds.
- Tropical and subtropical zones (10a and above) have frost dates approaching or past January. For these zones, heat tolerance and humidity through the early fall window are more relevant constraints than frost proximity.
- The tool covers 50 US states by ZIP prefix. It does not support Canadian postal codes, territories, or international locations.
Standards, Safety Checks, and “Secret Sauce” Warnings
Critical Warnings
- Long-season crops need the full window, not “most of it”: Pumpkins require 90 days. If you have 75 days to frost, they will not produce edible, fully mature fruit. The vine may survive, but the fruit development stalls in the final weeks when temperatures drop below the threshold for starch conversion. This is not a close call; it is a hard cutoff.
- Row cover does not substitute for adequate heat accumulation: Frost protection from fabric keeps temperatures above freezing, but warm-season crops like tomatoes and peppers require cumulative warmth (growing degree days) to set and ripen fruit. Adding row cover does not add heat; it only prevents killing cold. For a crop that needs 68 days and has 55 days left, row cover keeps the plant alive longer but does not accelerate fruit maturation.
- The frost date is not the end of usable growing time for cold-hardy crops: Kale, spinach, carrots, and beets improve in flavor after light frosts. For these crops, the first frost date is not a hard stop. The calculation’s “Too Late” flag applies to crops that cannot tolerate any frost, not to cold-hardy varieties.
- High-altitude ZIP codes return lowland zone data: A ZIP code spanning a mountain valley and a high alpine area will return the zone for the dominant population center, which is typically lower. Growers at elevation above 6,000 feet should reduce the days-remaining estimate by 7-14 days for conservative planning and place a min/max thermometer at plant level to catch early frost events that the regional average will miss.
Minimum Standards
- Use the 30th percentile frost probability date for planning, not the 50th percentile. The 50th percentile means frost is equally likely before or after that date. A 30th percentile date gives a more conservative planning buffer for crops with narrow windows.
- For any crop within 10 days of its minimum viable window, treat it as “borderline” rather than “safe.” Factor in at least one week of margin for weather variability. A properly sized greenhouse heater can extend the window further than row cover alone for high-value crops.
Competitor Trap: Many frost date pages list only “average first frost date” by city or zone with no further context. That single number tells you nothing about whether your specific crops can finish in the time remaining, what protection strategies can extend the window, or how conservative or optimistic the stated date actually is. A date without a days-to-maturity comparison is a trivia answer, not a planting decision.
Common Mistakes and Fixes
Mistake: Treating the Frost Date as a Hard, Exact Deadline
The first frost date from USDA zone data is a historical average, not a weather forecast. Frost can arrive two to three weeks earlier than the average in a cold year, or two to three weeks later in a warm one. Growers who plant right up to the calculated margin with no buffer regularly lose crops to early frost events. Use the calculator’s date as a planning anchor, but build in a one-week buffer for anything that matters.
Fix: Subtract 7-10 days from the displayed days-remaining figure before making final planting decisions.
Mistake: Planting from Seed When Transplants Are the Only Viable Option
A crop with 60 days to maturity started from seed actually needs 65-75 days once germination time is included. If the calculator shows 63 days remaining and you direct sow a 60-day crop, you are operating on a 3-day margin against an imprecise date estimate. Using transplants started indoors 4-6 weeks earlier is the correct strategy for borderline crops. Tracking how well your seedlings are developing can be supported by reviewing heat mat temperature targets for optimal germination rates.
Fix: For any crop within 15 days of the days-remaining cutoff, use nursery transplants rather than direct sowing.
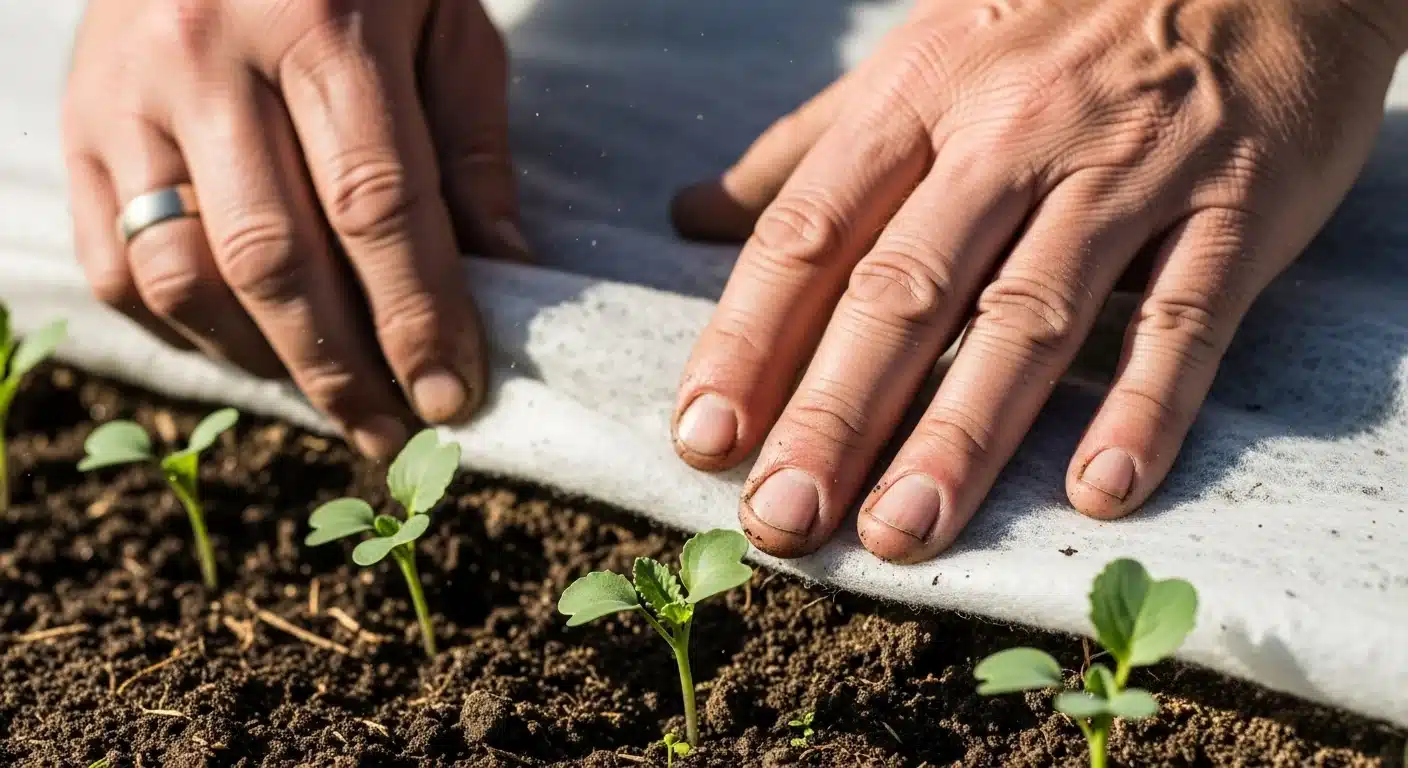
Mistake: Applying Row Cover Without Ventilation Management
Row cover fabric traps heat. On a sunny fall afternoon with 70-degree air temperature, an enclosed row cover can reach 90+ degrees, which stresses and can kill the same crops it was meant to protect. Many growers apply fabric at the start of September and never lift it until they check on the plants. The protection gain only applies to overnight frost events, not to daytime heat stress.
Fix: Vent or partially lift row covers on any day where daytime temperatures exceed 65 degrees Fahrenheit. A simple max thermometer placed under the fabric for one afternoon tells you whether your specific setup is running dangerously warm.
Mistake: Confusing First Frost Date With Last Frost Date
The spring “last frost date” is when it is safe to plant cold-sensitive crops outdoors. The fall “first frost date” is when those crops must be done or protected. Growers new to season planning sometimes search “frost date calculator” expecting the spring planting guidance and apply the fall frost date to spring decisions, or vice versa. The two dates are entirely different reference points.
Fix: This calculator is exclusively for fall planning. For spring planting windows, use a dedicated last-frost lookup tool for your region.
Mistake: Ignoring Microclimatic Frost Pockets
Low-lying areas, north-facing slopes, areas surrounded by dense windbreaks, and raised beds on exposed ground all experience frost differently from the regional average. A frost pocket in a valley bottom can be 5-8 degrees colder than an open field 200 meters away, which can shift the effective first frost date by 10-14 days. Shade cloth management also affects retained soil heat; understanding how your shade cloth percentage affects daytime temperature can help you model these microclimate effects.
Fix: Place a min/max thermometer at plant level in your growing area at least two weeks before the calculated frost date to detect whether your site runs ahead of or behind the regional average.
Next Steps in Your Workflow
Once you know how many days remain and which crops are viable, the next decision is light. As days shorten through September and October, photosynthetically active radiation drops significantly even in frost-free zones. Crops that technically have enough calendar days may still underperform because they lack sufficient light energy to drive growth. Running a daily light integral calculation for your fall conditions reveals whether natural light alone will sustain your target crops through to harvest, or whether intervention is needed.
For growers with a greenhouse or low tunnel setup, the frost countdown shifts from a hard deadline to a management schedule. Knowing your days to frost helps size your heating system, schedule your last outdoor transplant date, and decide when to move container plants inside permanently. If you are extending the season indoors, calculating your supplemental lighting requirements for the reduced winter photoperiod is the logical follow-on step after this calculator.
FAQ
What is a first frost date and how is it calculated?
A first frost date is the historical average calendar date when air temperatures at ground level first drop to approximately 28-32 degrees Fahrenheit in a given region. It is calculated from decades of weather station records compiled by NOAA and organized by geographic region using USDA Hardiness Zones. The date represents a statistical average, not a forecast.
Why does my ZIP code return a different zone than my neighbors who are in the same town?
ZIP prefix region mapping covers broad areas. Two ZIP codes in the same town but different prefixes may land in slightly different zone approximations. For high-stakes growing decisions, verify your exact USDA zone using the official USDA Plant Hardiness Zone Map at planthardiness.ars.usda.gov, which uses much finer geographic resolution than ZIP prefix lookup.
How many days does row cover actually add to the growing season?
Lightweight spunbond horticultural fabric (1.0-1.5 oz per square yard) typically provides frost protection down to 28-29 degrees Fahrenheit, extending the effective season by 14-21 calendar days on average. Heavier fabric (2 oz and above) can add 21-28 days but requires active ventilation management on warm days to prevent heat stress to plants.
Can I use this calculator for fall planting of cover crops or winter vegetables?
Yes, with a qualifier. Cold-hardy crops like kale, spinach, garlic, and winter rye are frost tolerant and do not use the same hard cutoffs as warm-season vegetables. The crop table in this tool focuses on harvest maturity, which matters less for cover crops that are terminated before they set seed. For cold-hardy edibles, the relevant question is whether they will establish root systems before hard ground freeze, not whether they will mature before first frost.
What is the difference between a 30th percentile and 50th percentile frost date?
A 50th percentile frost date means that in half of historical years on record, frost occurred before that date and in half it occurred after. A 30th percentile frost date is earlier, representing a more conservative buffer: frost occurred before that date in only 3 out of 10 historical years. This calculator uses 30th percentile estimates to reduce the risk of false confidence in late-season planting.
My calculated frost date has already passed but I have not had frost yet. What should I do?
Historical frost dates are averages, and any given season can run 2-3 weeks warm or cold. If your estimated date has passed without frost, you may have additional growing days remaining. Continue monitoring your local forecast for overnight low temperatures approaching 32 degrees Fahrenheit. Protect sensitive crops when the forecast shows temperatures within 5 degrees of freezing, even if the historical date has not yet arrived.
Conclusion
The first frost date calculator’s core value is not the date itself but the crop-by-crop safety grid it generates from that date. Knowing you have 47 days to frost is abstract. Knowing that tomatoes need 65 days, cucumbers need 50, and radishes need 25 converts that number into a specific set of decisions: which crops to harvest now, which to protect with row cover, and which to abandon for direct sowing this season in favor of transplants or a spring restart.
The single most consequential mistake this tool is designed to prevent is planting long-season crops with an inadequate window and assuming “close enough” will work. A pumpkin vine with 70 days left will not produce ripe fruit. Calendar proximity to a crop’s maturity requirement is not a cushion; it is a hard biological threshold. Cross-reference every borderline decision against the crop table before committing seed to soil. For growers building a full climate management system, reviewing your greenhouse plastic light transmission helps ensure that season-extended crops get adequate photosynthetically active radiation even as natural light levels decline through fall.
Lead Data Architect
Umer Hayiat
Founder & Lead Data Architect at TheYieldGrid. I bridge the gap between complex agronomic data and practical growing, transforming verified agricultural science into accessible, mathematically precise tools and guides for serious growers.
View all tools & guides by Umer Hayiat →


