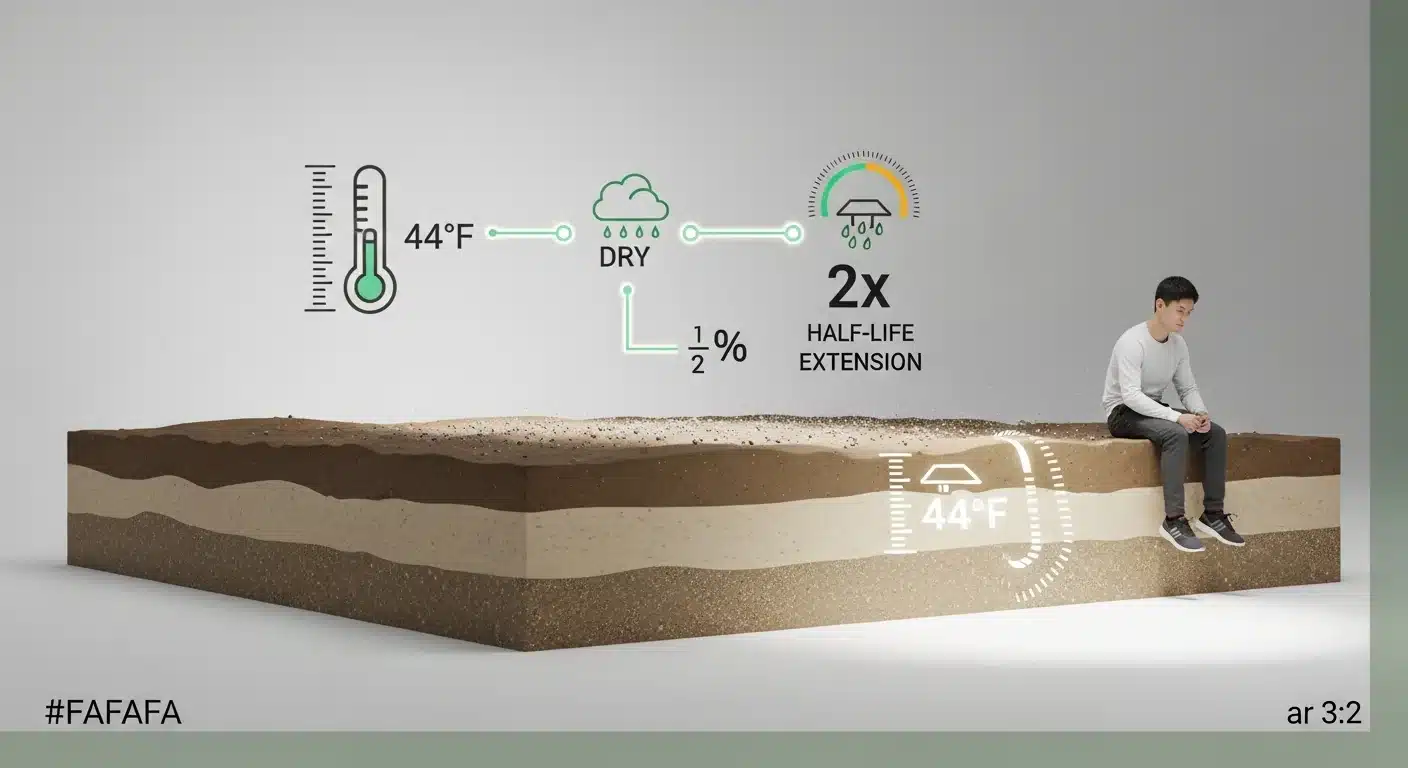
Herbicide persistence is not a fixed number on a label. The half-life printed in a product’s use guide assumes adequate soil moisture and microbial activity near 77°F. When soil temperatures drop below 50°F or rainfall is scarce for months, the bacteria responsible for breaking down herbicide residue essentially stop working. The chemical half-life pauses. What the label says should be gone by spring may still be present at phytotoxic concentrations when your next crop germinates.
This calculator takes the actual conditions since your application date and adjusts the herbicide’s half-life accordingly. It outputs the estimated remaining concentration in ounces per acre, compares that figure against the known injury threshold for your planned crop, and issues a traffic-light warning when risk is detected. It does not replace a certified lab soil bioassay, and it does not account for herbicide movement below the root zone, volatilization, or photolysis. Those variables require on-site testing. What it provides is a decision-quality estimate based on environmental inputs you can measure or retrieve from weather records. For questions about how much active ingredient was in your original application, the active ingredient per acre calculator can help you convert product rates to pure AI before entering them here.
Bottom line: After running your numbers, you will know whether remaining residue is safely below, near, or above your next crop’s injury threshold. That single output determines whether you proceed with planting, wait, or pursue emergency soil remediation.
Use the Tool
Herbicide Half-Life & Plant-Back Restriction
Calculate actual herbicide carryover based on environmental conditions — herbicide carryover calculator
Carryover Analysis Results
Fill in all fields above, then click Calculate Carryover
Results will appear here after you click Calculate Carryover.
How This Calculator Works — Formula & Assumptions
Step 1 — Base Half-Life Lookup
Each herbicide has a documented base half-life (t½) under ideal microbial conditions (soil temp ~77°F, adequate moisture). This is looked up from a built-in reference table.
Step 2 — Environmental Adjustment
Microbial degradation slows in cold or dry soils. A temperature factor (temp_f) and a moisture factor (moisture_f) are multiplied to compute the adjusted half-life. Cold soil (<50°F) or dry conditions (<3 in rainfall) dramatically extend persistence.
Step 3 — Exponential Decay
Herbicide residue decays exponentially. The remaining concentration after N days is:
Step 4 — Crop Tolerance Check
Each crop has a known tolerance threshold. If Remaining exceeds the threshold, a Carryover Kill Warning is issued. This is the “Dry Winter” effect: if cold, dry soil paused bacterial activity, your next crop can still be destroyed by herbicide that should have degraded.
Units & Assumptions
- Rate entered as oz product per acre; calculation uses relative concentration (ratio)
- Half-life values are medians from peer-reviewed field studies under normal soil conditions
- Environmental factors are simplified models; actual decay varies with soil type, pH, and OM
- Does not account for volatilization, leaching below root zone, or photolysis
- Results are advisory — always consult the product label and an agronomist
Reference: Herbicide Half-Lives & Common Crop Tolerances
| Herbicide | Base t½ (days) | Risk Crop | Tolerance (oz/ac) |
|---|---|---|---|
| Atrazine | 60 | Soybeans | 0.10 |
| Mesotrione | 30 | Soybeans, Wheat | 0.08 |
| Chlorsulfuron | 40 | Most broadleaf | 0.03 |
| Clopyralid | 45 | Soybeans, Sunflower | 0.12 |
| Dicamba | 14 | Soybeans, Vegetables | 0.10 |
| Imazapyr | 90 | All crops | 0.02 |
| Glyphosate | 47 | Low risk | Stable |
Half-life values are field medians under normal conditions (soil temp ~77°F, adequate moisture). Source: EPA, university extension publications.
[put the tool here]
Before you start, gather the following: the herbicide active ingredient (not the brand name), the original application rate in ounces of product per acre, the number of days that have passed since application, the average soil temperature at a 4-inch depth since that date, and total cumulative rainfall since the application date. If you applied multiple active ingredients in a tank mix, run each one separately. A reading from an agricultural weather station or state extension weather network will give you a more accurate soil temperature than an air temperature estimate.
Quick Start (60 Seconds)

- Herbicide Active Ingredient: Select from the dropdown. Use the active ingredient, not the trade name. Atrazine is atrazine, not Aatrex. If your product contains multiple active ingredients, run separate calculations.
- Initial Application Rate: Enter in ounces of product per acre exactly as applied. Do not enter pounds per acre or rate per 1,000 sq ft. Convert before entering.
- Days Since Application: Count calendar days from the spray date to today, or to the planned planting date if you are projecting forward. Rounding to the nearest 5 days is acceptable; rounding to the nearest month introduces meaningful error.
- Average Soil Temperature (°F): Use 4-inch depth readings averaged over the entire period since application, not the air temperature and not a single spot reading. Values below 50°F will trigger significant half-life extension.
- Rainfall Since Application (inches): Enter cumulative precipitation, not daily averages. Less than 3 inches total over the period will trigger a moisture adjustment that meaningfully extends the effective half-life.
- Planned Next Crop: Choose the crop you intend to plant. Tolerance thresholds differ substantially between species. Soybeans and vegetables are far more sensitive than corn to most residual herbicides.
Inputs and Outputs (What Each Field Means)
| Field | Unit | What It Means | Common Mistake | Safe Entry Guidance |
|---|---|---|---|---|
| Herbicide Active Ingredient | Selection | The chemical compound responsible for herbicidal activity, not the branded product name | Selecting a trade name and guessing the AI; Aatrex, Bicep, and Lexar all contain atrazine at different percentages | Check the product label’s “Active Ingredient” line, not the front panel |
| Initial Application Rate | oz product/acre | Total volume of formulated product applied per acre, as sprayed | Entering the AI rate rather than the product rate; or confusing fl oz and dry oz on liquid formulations | Use the same units you measured in the tank. Do not convert to pounds unless the tool asks for pounds. |
| Days Since Application | Calendar days | Elapsed time between the spray date and either today or the planned planting date | Using growing degree days or active days instead of calendar days. This formula uses calendar days. | Count from the exact spray date. If applied over multiple days, use the first application date. |
| Average Soil Temperature | °F (4-inch depth) | Mean soil temperature at the zone where microbial activity primarily occurs | Using air temperature as a proxy; air temps can run 10-20°F higher than soil temps in winter | Retrieve from a state extension weather network or NRCS soil temperature dataset if you lack a sensor |
| Rainfall Since Application | Cumulative inches | Total precipitation received since the spray date, not a daily or monthly average | Entering a monthly average and multiplying by months; irregular distribution matters but this tool uses cumulative total as a moisture index | Sum all precipitation events from weather records or a rain gauge. Include significant irrigation events. |
| Planned Next Crop | Selection | The crop species to be planted next, used to determine the specific injury tolerance threshold | Selecting a tolerant crop like corn to get a green result, then actually planting sensitive soybeans in that field | Select the crop you will actually plant, not a tolerant crop to test the baseline |
| Remaining (oz/acre) [Output] | oz/acre | Estimated herbicide residue after the elapsed time, adjusted for actual environmental conditions | Comparing this to the original application rate instead of to the crop’s tolerance threshold | The number to watch is whether this exceeds the tolerance shown in the Warnings box, not the original rate |
| Adjusted Half-Life [Output] | Days | The actual effective half-life under your reported conditions, modified by temperature and moisture factors | Assuming the adjusted half-life equals the base half-life from the label | Cold and dry conditions can extend this to 2x-3x the base figure |
Worked Examples (Real Numbers)
Scenario 1: Atrazine on Corn Fields, Soybeans Planted the Following Year After a Dry, Cold Winter
- Herbicide: Atrazine (base half-life: 60 days)
- Application Rate: 32 oz/acre
- Days Since Application: 300
- Average Soil Temperature: 44°F (cold winter, no freeze-thaw recovery)
- Rainfall Since Application: 1 inch (drought conditions persisted)
- Planned Crop: Soybeans (injury threshold: 0.10 oz/acre)
Temperature factor: 1 + (77 – 44) / 30 = 2.10
Moisture factor: 1 + ((3 – 1) / 3) x 0.8 = 1.53
Adjusted half-life: 60 x 2.10 x 1.53 = 193 days
Remaining: 32 x 0.5^(300/193) = 32 x 0.5^1.554 = 32 x 0.341 = 10.91 oz/acre
Result: DANGER. Estimated 10.91 oz/acre remaining, 109x above the soybean injury threshold of 0.10 oz/acre.
This is the classic dry-winter carryover kill scenario. Even after 300 days, an Atrazine application under cold, dry conditions has degraded less than a single half-life’s worth. Soybeans planted in this field in spring would be expected to suffer severe chlorosis and death.
Scenario 2: Chlorsulfuron Applied to Winter Wheat, Corn Rotated In the Same Season
- Herbicide: Chlorsulfuron (base half-life: 40 days)
- Application Rate: 4 oz/acre
- Days Since Application: 90
- Average Soil Temperature: 68°F (warm spring)
- Rainfall Since Application: 5 inches
- Planned Crop: Corn (injury threshold: 0.10 oz/acre)
Temperature factor: 1 + (77 – 68) / 30 = 1.30
Moisture factor: 1.0 (rainfall above 3 inches, no moisture adjustment)
Adjusted half-life: 40 x 1.30 = 52 days
Remaining: 4 x 0.5^(90/52) = 4 x 0.5^1.731 = 4 x 0.301 = 1.21 oz/acre
Result: DANGER. Estimated 1.21 oz/acre remaining, more than 12x above corn’s injury threshold of 0.10 oz/acre.
Even under relatively favorable degradation conditions, a 90-day rotation to a sensitive crop is insufficient after a chlorsulfuron application. The label’s plant-back interval for corn from wheat exists precisely to prevent this situation, but growers sometimes attempt early rotations after wet, warm springs believing conditions will accelerate breakdown.
Scenario 3: Mesotrione on Corn, Wheat Planted 270 Days Later Under Favorable Conditions
- Herbicide: Mesotrione (base half-life: 30 days)
- Application Rate: 12 oz/acre
- Days Since Application: 270
- Average Soil Temperature: 70°F
- Rainfall Since Application: 7 inches
- Planned Crop: Wheat (injury threshold: 0.08 oz/acre)
Temperature factor: 1 + (77 – 70) / 30 = 1.23
Moisture factor: 1.0 (rainfall above 3 inches)
Adjusted half-life: 30 x 1.23 = 37 days
Remaining: 12 x 0.5^(270/37) = 12 x 0.5^7.30 = 12 x 0.00630 = 0.076 oz/acre
Result: Safe. Estimated 0.076 oz/acre remaining, below wheat’s injury threshold of 0.08 oz/acre at this time point.
At 270 days under warm, adequately moist conditions, mesotrione has completed enough half-lives to fall just below the wheat injury threshold. Planting 2 to 3 weeks earlier under these same conditions would have returned a borderline or caution result, which illustrates why counting calendar days from the label’s minimum interval is insufficient without verifying environmental conditions.
Reference Table (Fast Lookup)
All residue values below are computed using the tool’s formula. “Normal” conditions assume a soil temperature of 65°F and 5 inches of cumulative rainfall. “Cold/Dry” assumes 44°F and 1 inch of cumulative rainfall. All figures use a 365-day elapsed period. Typical application rates are used for each herbicide; results scale proportionally with rate.
| Herbicide | Base t½ (days) | Adj. t½ Cold/Dry (days) | Typical Rate (oz/ac) | Residue at 365 Days: Normal (oz/ac) | Residue at 365 Days: Cold/Dry (oz/ac) | Soybean Threshold (oz/ac) | Cold/Dry Risk Level |
|---|---|---|---|---|---|---|---|
| Atrazine | 60 | 193 | 32 | 1.58 | 8.66 | 0.10 | Extreme |
| Mesotrione | 30 | 97 | 12 | 0.029 | 0.87 | 0.08 | Very High |
| Chlorsulfuron | 40 | 129 | 4 | 0.044 | 0.56 | 0.03 | Extreme |
| Clopyralid | 45 | 145 | 12 | 0.22 | 2.11 | 0.12 | Very High |
| Dicamba | 14 | 45 | 16 | < 0.001 | 0.060 | 0.10 | Low |
| Imazapyr | 90 | 290 | 8 | 1.07 | 3.34 | 0.02 | Extreme |
| Glyphosate | 47 | 151 | 32 | 0.68 | 6.04 | 5.00 | Borderline |
| Dicamba (low rate) | 14 | 45 | 4 | < 0.001 | 0.015 | 0.10 | Safe |
Derived values. Environmental multiplier for Cold/Dry: temperature factor 2.10 x moisture factor 1.53 = 3.22x base half-life. These are estimates; actual field persistence varies with soil type, pH, organic matter, and microbial community. All residue values in oz of product per acre.
How the Calculation Works (Formula + Assumptions)
Show the calculation steps
Step 1: Look up the base half-life. Each herbicide active ingredient has a field-median half-life at optimal microbial conditions (approximately 77°F soil temperature and adequate moisture). This is stored in the tool’s reference table.
Step 2: Compute the temperature factor.
Temperature Factor = 1 + max(0, (77 - SoilTemp_F) / 30)
At 77°F the factor is 1.0 (no extension). At 47°F the factor is 2.0, meaning the half-life doubles. Below 32°F microbial activity approaches zero; the factor continues to grow, reflecting the slowdown. The factor does not decrease below 1.0 for soils warmer than 77°F because the simplified model does not account for accelerated high-heat degradation, which is a known limitation.
Step 3: Compute the moisture factor.
Moisture Factor = 1 + max(0, (3 - Rainfall_in) / 3) x 0.8
Soils that received 3 or more inches of rainfall receive a factor of 1.0 (no extension). At 0 inches the factor is 1.8, extending the half-life by 80%. The threshold of 3 inches is a simplified proxy for adequate soil moisture; this does not model soil type-specific field capacity.
Step 4: Compute the adjusted half-life.
Adjusted t½ = Base t½ x Temperature Factor x Moisture Factor
Step 5: Apply exponential decay.
Remaining (oz/ac) = Initial Rate x (0.5) ^ (Days / Adjusted t½)
% Remaining = (Remaining / Initial Rate) x 100
Results are rounded to 4 decimal places for the primary output and 1 decimal place for percentage display.
Step 6: Compare against crop tolerance threshold.
Each crop-herbicide pairing has a threshold. If remaining exceeds the threshold, a danger warning is issued. If remaining is between 60% and 100% of the threshold, a caution warning is issued. Below 60% of the threshold is classified as safe.
Assumptions and Limits
- Half-life values are field medians from published studies; individual field variation around the median is significant (typical range: 0.5x to 3x the median for the same herbicide)
- The temperature factor uses a linear model. Actual microbial response to temperature is non-linear and community-specific.
- Rainfall is used as a cumulative moisture proxy. Timing and intensity of rainfall events matters; 5 inches in a single event followed by dry conditions behaves differently than 5 inches distributed over 30 days.
- The model does not account for clay content, soil organic matter, or pH, which can substantially alter herbicide sorption and bioavailability.
- Volatilization and photolysis are not modeled. For volatile herbicides like dicamba, this can mean the tool slightly overestimates remaining residue.
- Tank mix interactions and synergistic effects between multiple active ingredients are not captured; run each AI separately.
- Application uniformity is assumed. Spray overlaps or skips will produce local concentrations that deviate from the field-average result.
- The tool produces an estimate, not a laboratory measurement. A soil bioassay or certified lab extraction is required for confirmed regulatory or insurance decisions.
Standards, Safety Checks, and Secret Sauce Warnings
Critical Warnings
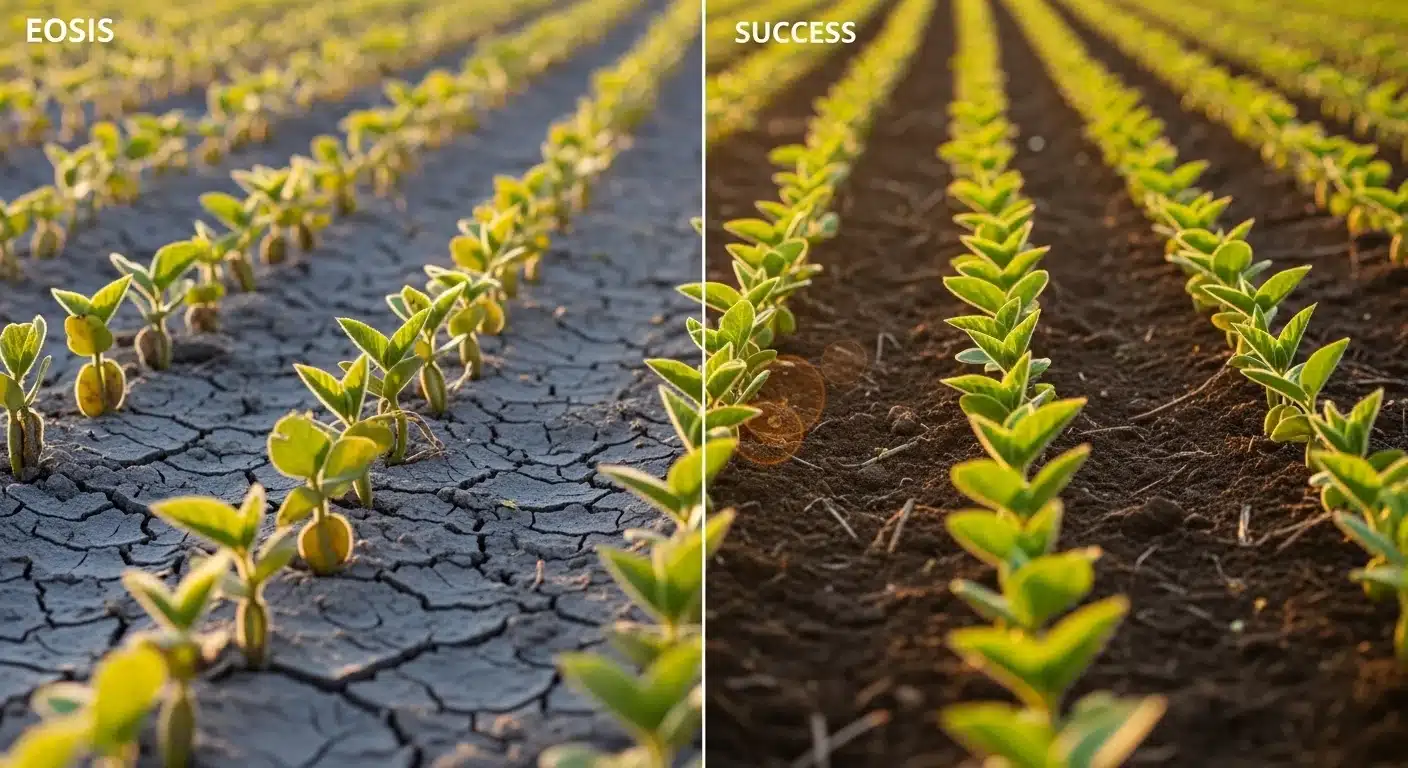
- The Dry Winter Carryover Kill: This is the failure mode that destroys fields every year. A grower applies Atrazine to corn in June. The following May, soybeans are planted. The beans emerge, turn white, and die. The label’s plant-back interval assumed normal microbial activity. A cold, dry winter stopped bacterial degradation for 4 to 6 months. The chemical half-life paused. This tool is specifically designed to detect that pause. If your soil temperature average was below 50°F and rainfall was below 2 inches over the winter period, your adjusted half-life may be 2 to 3 times the base value, and a nominal “safe” interval becomes a kill zone. Understanding how herbicide residue interacts with soil chemistry broadly is related to work done with the soil leaching requirement calculator, which addresses how water movement affects chemical persistence in different soil profiles.
- Crop Sensitivity Is Not Uniformly Distributed: Most growers know soybeans are sensitive to atrazine carryover. Fewer know that chlorsulfuron injures corn at concentrations as low as 0.03 oz/acre, and that imazapyr has an injury threshold for all common crops below 0.02 oz/acre at a base half-life of 90 days. Using this tool only when planting sensitive soybeans misses the risk entirely when rotating to other supposedly tolerant species. Always run the specific crop you are planting, not a general “is it gone yet” check.
Minimum Standards
- The result from this tool should never be the sole basis for a planting decision when residue is within 2x of a crop tolerance threshold. A soil bioassay from a certified lab provides direct confirmation that no simplified decay model can replicate.
- If the tool returns a danger result, do not assume that waiting a few more weeks resolves the problem without rerunning the calculation with updated elapsed days. The adjusted half-life determines how fast that danger drops, and it may be much slower than expected. Soil pH is a compounding variable: the soil pH sulfur calculator is relevant because high-pH soils slow breakdown of certain ALS inhibitors like chlorsulfuron dramatically more than the base half-life suggests.
Competitor Trap: Many herbicide persistence tools on the internet ask only for the chemical name and number of days, then return a fixed percentage remaining based on the base half-life alone. This approach produces a systematically optimistic result in any year with below-normal precipitation or a cold dormant season. A calculator that ignores soil temperature and rainfall is not modeling biological degradation; it is modeling time, which is an entirely different thing. The biological decay rate that governs plant-back safety is driven by microbial activity, and microbes respond to temperature and moisture, not the calendar. Always use a tool that adjusts for both environmental variables, and always be skeptical of any “percent degraded” claim that does not ask you for weather conditions. For context on how application rates and surfactant ratios interact with herbicide performance at the spray event itself, the non-ionic surfactant ratio calculator addresses the application side of the equation.
Common Mistakes and Fixes
Mistake: Using Air Temperature Instead of Soil Temperature
Air temperature in winter and early spring consistently runs 10°F to 20°F above 4-inch soil temperature. Entering air temperature as the soil input underestimates the half-life extension from cold conditions. A grower entering 55°F air temperature when the actual soil was 38°F will see a significantly lower adjusted half-life and a more optimistic residue estimate than field conditions warrant.
Fix: Retrieve 4-inch soil temperature averages from a state agricultural weather network, NRCS SCAN station, or your own soil temperature probe.
Mistake: Treating the Label’s Plant-Back Interval as a Guarantee
Plant-back intervals on herbicide labels are minimums established under controlled or representative field conditions. They do not account for anomalous weather. A label may say 18 months for a sensitive crop rotation, but that 18 months implicitly assumes functional microbial activity for most of that period. A cold, dry year between application and rotation collapses that assumption entirely.
Fix: Use the label interval as a floor, not a ceiling. Run this calculator with your actual environmental data before planting any sensitive crop.
Mistake: Running the Calculation Only at the Planned Planting Date
Growers often run a carryover check the week before planting, find a borderline result, and either proceed anyway or wait a week. The more useful approach is to run the calculation at 30-day intervals starting 90 days before the intended planting window. This reveals whether the decay curve is moving toward safe territory fast enough, or whether a planting date adjustment of weeks versus months is needed.
Fix: Use the “Days Since Application” field to project forward. Run the calculation with your planned planting date minus today to see where residue will be at planting, then check again at 30-day increments.
Mistake: Ignoring the Moisture Factor When Rainfall Looks Adequate on Paper
A grower who received 4 inches of rainfall in October and then 0 inches from November through April may enter a cumulative figure that looks adequate. But that 4 inches fell at a time when soil temperatures were also dropping and microbial activity was slowing. The rainfall benefit overlapped with cold-temperature suppression. The cumulative rainfall figure masks a functionally dry winter period for microbial purposes. Understanding fertilizer and soil chemistry interactions after replanting is worth connecting to tools like the fertilizer salt index calculator, which models how certain post-treatment soil inputs affect the soil environment where degradation occurs.
Fix: Use cumulative rainfall as the tool asks, but when rainfall was heavily front-loaded and the subsequent months were dry, consider running a conservative scenario with a lower rainfall input to bracket the true risk.
Mistake: Running One Calculation for a Field With Variable History
Fields are not uniform. A 400-acre field may have areas where application rate, soil type, or drainage differs substantially from the average. Running a single calculation with average inputs may return a safe result while a portion of the field retains dangerous residue concentrations due to lower microbial activity in heavier clay soils or spray overlap zones.
Fix: For high-stakes decisions, run calculations using the highest plausible application rate and the most conservative environmental conditions observed in the field, not the averages.
Next Steps in Your Workflow
If the calculator returns a safe result for your herbicide and crop combination, the next step is not to file the result away. It is to confirm whether the other soil inputs for your rotation are in order. A field recovering from herbicide stress that also has inadequate fertility or pH imbalance will underperform even if no carryover injury occurs. The NPK calculator can help you build a fertility plan suited to the crop going in, and confirming that your planned inputs are calibrated to the replanting crop is a standard workflow step before putting seed in the ground.
If the calculator returns a danger or caution result, your options are to delay planting and recheck periodically, pursue activated carbon or biochar soil incorporation to bind residual AI, or contact a crop insurance consultant to understand whether herbicide carryover damage qualifies for coverage in your policy. Before making any amendment decisions, confirming your soil’s baseline organic matter and structure with a compost or organic matter analysis is useful context; the compost calculator provides a framework for thinking about organic amendment rates if you are attempting to improve microbial activity ahead of replanting.
FAQ
What is chemical half-life in soil and why does it matter for plant-back decisions?
Chemical half-life in soil is the time required for half of the original herbicide concentration to be broken down by microbial activity or chemical processes. It matters for plant-back because the remaining concentration after multiple half-lives determines whether a sensitive crop will encounter phytotoxic levels at germination. A longer half-life means residue persists longer; a shorter half-life means faster clearance.
Why does atrazine carryover math differ so much from one field to the next?
Atrazine carryover varies because its base half-life of roughly 60 days assumes warm, moist soil. In sandy soils with high drainage, it may clear faster. In high-pH or cold clay soils, it may persist for years. The same application rate and the same number of elapsed days can produce radically different remaining concentrations depending on soil temperature and moisture history, which is why this tool adjusts for both.
What is plant-back restriction and how is the interval determined?
A plant-back restriction is the minimum time that must elapse after applying a herbicide before a sensitive crop can be planted without injury risk. Labels establish these intervals using field trial data under representative conditions. The interval is designed to ensure that under normal degradation conditions, residue falls below the crop’s injury threshold by planting time. Abnormal weather can invalidate these intervals, which is the core problem this tool addresses.
Can I use this calculator for herbicide tank mixes with multiple active ingredients?
Run a separate calculation for each active ingredient in the tank mix. The tool calculates persistence for one herbicide at a time. The limiting factor for your plant-back decision is whichever active ingredient shows the highest residue relative to its crop-specific tolerance threshold, so check all components and use the most restrictive result.
Does rainfall above 3 inches always make herbicide breakdown faster?
This tool treats 3 inches of cumulative rainfall as the threshold for adequate microbial soil moisture, above which no moisture penalty is applied. Rainfall beyond 3 inches does not accelerate breakdown in the model, though in practice very high rainfall can leach some herbicides below the active root zone. This model does not account for that leaching effect, which means it may slightly overestimate surface-level residue in heavily leached profiles.
What should I do if the tool shows a danger result but I need to plant soon?
A danger result means estimated residue exceeds the crop’s injury threshold. Practical options include delaying planting and rechecking in 30-day increments, ordering a certified soil bioassay to confirm actual residue levels, consulting an agronomist about activated carbon incorporation as an emergency binding agent, or contacting your crop insurance agent to understand carryover injury coverage. Do not assume visual field inspection will reveal whether residue is at phytotoxic levels before germination.
Conclusion
The number that drives plant-back decisions is not the calendar date or the label’s minimum interval. It is the estimated remaining concentration under your specific environmental conditions compared to the tolerance threshold of your specific next crop. This calculator makes that comparison directly, using soil temperature and cumulative rainfall to adjust the herbicide half-life to reflect what actually happened in your soil over the past months, not what the label assumed would happen under average conditions.
The single most common mistake in herbicide carryover assessment is trusting a fixed time interval without accounting for the winter the field actually experienced. A cold, dry dormant season can extend the effective half-life by two to three times, turning what looked like a safe rotation into a crop kill. Run your numbers with your actual conditions, bracket the uncertainty by checking both optimistic and conservative input scenarios, and do not plant into a field that returns a danger result without independent confirmation from a certified soil bioassay. For additional context on how herbicide application rates and chemical concentrations translate to field-scale impact, the pesticide dilution calculator covers the upstream calculation of accurately mixing herbicide solutions before they ever reach the soil.

Lead Data Architect
Umer Hayiat
Founder & Lead Data Architect at TheYieldGrid. I bridge the gap between complex agronomic data and practical growing, transforming verified agricultural science into accessible, mathematically precise tools and guides for serious growers.
View all tools & guides by Umer Hayiat →