Proportioner-based fertigation looks simple on the surface: set a dilution ratio, drop a fertilizer into a stock tank, and let the injector do the math. The problem is that “simple” breaks down the moment a grower mixes the wrong pair of fertilizers into the same concentrated tank. Calcium sulfate, known commercially as gypsum, precipitates immediately from certain combinations at high concentrations, turning a $400 batch of stock solution into an irreversible solid mass at the bottom of the tank. Most fertilizer rate guides do not mention this. This one does, and the tool above checks for it automatically. For a broader view of how N-P-K ratios translate across fertilizer labels, that resource covers the interpretation step before you ever reach the injector.
This fertilizer injector calculator computes three interconnected values: the ounces of water-soluble fertilizer needed per gallon of stock solution, the total weight required to fill a stock tank of a given size, and the estimated electrical conductivity the diluted output solution will carry at the root zone. It does not account for water alkalinity, existing background EC in your source water, or multi-nutrient interactions beyond the nitrogen percentage on the fertilizer label. Those variables require physical measurement at the emitter.
Bottom line: After running this calculator, you will know the exact stock concentration to mix, whether your target PPM falls inside a safe delivery zone for your crop type, and whether the fertilizers you have selected are chemically compatible in the same tank.
Use the Tool
Fertilizer Injector Calculator
Soluble fertilizer dosatron PPM & EC mixer — The Yield Grid
Tank A Fertilizers
Tank B Fertilizers
Warnings & Standards
Recommended Equipment
- Dosatron Injector
- Mazzei Venturi Injector
- Bluelab EC/TDS Wand
- Jack’s Professional Fertilizer
- Submersible Mixing Pump
| Target N (PPM) | N% (e.g. 20-20-20) | Ratio 1:100 | Oz / Gal Stock | EC Added (mS) |
|---|
How This Calculator Works — Formula & Assumptions
Formula Steps
Step 2: TotalOunces = OuncesPerGalStock × TankSizeGal
Step 3: EC_added ≈ TargetPPM ÷ PPM_Scale (where Scale = 500, 700, or 640)
Step 4: StockPPM = TargetPPM × RatioFactor
Plain-Language Explanation
- OuncesPerGalStock — how many ounces of dry fertilizer you dissolve per gallon of stock solution. The constant 75 is derived from pounds-to-ounces (16) × ppm-per-oz-per-gal factor for water-soluble salts.
- TotalOunces — multiply by your tank size to get the total fertilizer needed to fill the stock tank.
- EC Added — estimated electrical conductivity contribution. Different EC meters use different PPM scales (500, 700, or 640). Select your meter’s scale for an accurate conversion.
- Stock PPM — the raw concentration inside the tank before dilution.
Assumptions & Limits
- EC estimates assume a single-salt solution. Blended fertilizers with multiple ions may read differently.
- Formula applies to fully water-soluble dry fertilizers only.
- Target PPM range: 1–600. Values above 350 PPM N are typically only used in high-rate fertigation programs.
- Injector ratio range: 1:10 to 1:500. Ratios outside this range are not typical for agricultural injectors.
- The Calcium Nitrate + Magnesium Sulfate incompatibility check is based on known gypsum precipitation chemistry.
- Water quality (alkalinity, hardness) is not accounted for — always test finished solution EC/pH.
- Results are for guidance only. Verify with physical EC/TDS measurements before full-scale application.
Before calculating, have the following on hand: the fertilizer bag's guaranteed analysis label (you need the nitrogen percentage, the first number in the N-P-K ratio), the injector's rated dilution ratio as a fraction such as 1:100 or 1:200, and the physical capacity of your stock tank in US gallons. If you are running two separate tanks, note which fertilizers go in each tank before touching the chemical compatibility checkboxes. A closely related resource for liquid-concentrate programs is the fertilizer dilution calculator, which handles fluid ounce and percent-by-volume inputs rather than dry weight.
Quick Start (60 Seconds)
- Target Nitrogen PPM: Enter the nitrogen delivery rate you want at the root zone, not the stock tank concentration. Most vegetable crops run between 100 and 250 PPM N. Enter a whole number; decimals are accepted but rarely needed for this input.
- Fertilizer Nitrogen %: Read the first number from the fertilizer's N-P-K label. A bag labeled 20-20-20 means 20% nitrogen. Enter only the nitrogen percentage here; do not add the phosphorus or potassium values.
- Injector Ratio Setting: Match this exactly to the dial or fixed ratio of your injector unit. A 1:100 ratio means one part stock for every 100 parts output water. If your injector uses a percentage scale, convert it: 1% equals 1:100, 2% equals 1:50.
- Stock Tank Size: Enter the usable volume in US gallons, not the total tank capacity if you leave headspace. Common sizes are 15, 30, and 55 gallons.
- PPM Conversion Scale: This setting must match your specific EC meter. Hanna Instruments and most US-sold meters use the 500 scale. Bluelab meters and most European instruments use the 700 scale. Using the wrong scale here produces a correct PPM result but a misleading EC readout.
- Chemical Compatibility Checkboxes: Select every fertilizer product going into Tank A and every product going into Tank B. The tool will flag any combination known to cause precipitation in concentrated solution. Do not skip this step if you are running a two-tank system.
- Click Calculate Mix: All fields must be complete before results appear. The tool will not run a partial calculation.
Inputs and Outputs (What Each Field Means)
| Field Name | Unit | What It Represents | Common Entry Mistake | Safe Entry Guidance |
|---|---|---|---|---|
| Target Nitrogen PPM | PPM (mg/L) | The nitrogen concentration you want delivered to the root zone after injector dilution | Entering the stock tank concentration rather than the final diluted target | Range 1 to 600; most field crops use 50 to 250; seedlings typically under 100 |
| Fertilizer Nitrogen % | Percent by weight | Nitrogen content from the guaranteed analysis on the fertilizer bag (first N-P-K number) | Using the total fertilizer rate rather than the nitrogen fraction alone | Range 0.1 to 50; most soluble fertilizers fall between 10 and 30 |
| Injector Ratio Setting | Ratio (1:X) | The volumetric dilution factor the injector applies to the stock solution | Confusing the ratio direction; 1:100 means 1 part stock to 100 parts water output | Verify against injector spec sheet; common Dosatron models range from 1:32 to 1:200 |
| Stock Tank Size | US gallons | Volume of the concentrated stock solution reservoir the injector draws from | Using metric liters instead of US gallons, understating tank volume by a factor of 3.79 | Range 1 to 500; enter usable fill volume, not maximum tank capacity |
| PPM Conversion Scale | Unitless (500, 700, or 640) | The conversion factor your specific EC meter uses to translate conductivity into PPM | Leaving on the default 500 scale when using a Bluelab meter that reads on the 700 scale | Check meter documentation; Hanna = 500, Bluelab = 700, Truncheon = 640 |
| Oz per Gal (Stock) | Fluid oz / US gal | How many ounces of dry fertilizer to dissolve per gallon of stock solution | Treating this as the application rate per gallon of irrigation water (it is not) | Values above 16 oz/gal exceed the solubility limit of most soluble fertilizers |
| Total Fertilizer Needed | Ounces and pounds | Total dry fertilizer weight to fill the entire stock tank at the computed concentration | Forgetting to recompute when tank size changes mid-season | Cross-check with bag size on hand before mixing |
| EC Added | mS/cm (millisiemens per centimeter) | Estimated electrical conductivity contribution from the fertilizer in the finished diluted solution | Comparing this value to a meter reading taken at the stock tank rather than at the emitter | Background EC from source water is additive; measure both separately |
| Stock PPM | PPM | The nitrogen concentration inside the stock tank before injector dilution | Confusing stock PPM with delivery PPM; the injector reduces this by the ratio factor | Informational only; stock PPM = Target PPM x Ratio factor |
Worked Examples (Real Numbers)
Example 1: Standard Vegetable Greenhouse, 20-20-20 at 1:100
- Target Nitrogen PPM: 150
- Fertilizer Nitrogen: 20% (20-20-20 soluble)
- Injector Ratio: 1:100
- Stock Tank Size: 55 gallons
- PPM Scale: 500 (Hanna meter)
Result: 10.00 oz per gallon of stock solution; 550 oz (34.4 lb) total for the 55-gallon tank; estimated EC added of 0.30 mS/cm.
At 150 PPM nitrogen and a 1:100 ratio, this falls squarely in the optimal zone for most leafy vegetables and fruiting crops in active vegetative growth. The 10 oz/gal stock concentration is within the solubility range for most 20-20-20 formulations, though water temperature affects the upper limit.
Example 2: Propagation Bench, 13-2-13 at 1:200 for Low-Feed Seedlings
- Target Nitrogen PPM: 75
- Fertilizer Nitrogen: 13% (13-2-13 propagation formula)
- Injector Ratio: 1:200
- Stock Tank Size: 30 gallons
- PPM Scale: 700 (Bluelab meter)
Result: 11.54 oz per gallon of stock solution; 346 oz (21.6 lb) total for the 30-gallon tank; estimated EC added of 0.11 mS/cm.
A high dilution ratio like 1:200 paired with a lower-nitrogen product keeps the per-gallon concentration moderate. The 0.11 mS/cm EC contribution is typical for propagation environments where accumulated salt stress is a primary risk. Background water EC should be measured and added to this figure before evaluating crop safety.
Example 3: High-Rate Pepper Fertigation, 20% N at 1:100 Targeting 250 PPM
- Target Nitrogen PPM: 250
- Fertilizer Nitrogen: 20%
- Injector Ratio: 1:100
- Stock Tank Size: 15 gallons
- PPM Scale: 500
Result: 16.67 oz per gallon of stock solution; 250 oz (15.6 lb) total for the 15-gallon tank; estimated EC added of 0.50 mS/cm.
At 16.67 oz/gal, this concentration is at the practical upper boundary of solubility for most granular fertilizers. Mixing at room temperature with vigorous agitation is recommended. The 250 PPM nitrogen delivery rate is appropriate for high-demand crops like peppers or tomatoes at peak fruiting but should be verified with physical EC readings before scaling to full production volume.
Reference Table (Fast Lookup)
All rows below use 20% nitrogen fertilizer and a 1:100 injector ratio as the baseline. The "Oz/Gal Stock" and "EC Added" columns are computed from the formula. EC is calculated using the 500 PPM scale. Adjust mentally for 700-scale meters by dividing the EC column by 1.4.
| Target PPM (N) | N% (Fertilizer) | Injector Ratio | Oz / Gal Stock | Total Oz (55-gal tank) | EC Added (mS/cm, 500 scale) | Delivery Zone |
|---|---|---|---|---|---|---|
| 50 | 20% | 1:100 | 3.33 | 183 oz (11.5 lb) | 0.10 | Low / Seedling safe |
| 75 | 20% | 1:100 | 5.00 | 275 oz (17.2 lb) | 0.15 | Low / Early growth |
| 100 | 20% | 1:100 | 6.67 | 367 oz (22.9 lb) | 0.20 | Optimal range |
| 150 | 20% | 1:100 | 10.00 | 550 oz (34.4 lb) | 0.30 | Optimal range |
| 200 | 20% | 1:100 | 13.33 | 733 oz (45.8 lb) | 0.40 | Optimal / Upper boundary |
| 250 | 20% | 1:100 | 16.67 | 917 oz (57.3 lb) | 0.50 | Moderate-high; monitor |
| 300 | 20% | 1:100 | 20.00 | 1,100 oz (68.8 lb) | 0.60 | High; near solubility limit |
| 150 | 20% | 1:200 | 20.00 | 1,100 oz (68.8 lb) | 0.30 | Solubility limit exceeded at 20% N |
| 100 | 13% | 1:100 | 10.26 | 564 oz (35.3 lb) | 0.20 | Optimal; propagation blend |
| 200 | 30% | 1:100 | 8.89 | 489 oz (30.5 lb) | 0.40 | Optimal; high-N product advantage |
The row at 150 PPM with a 1:200 ratio highlights a critical planning constraint: doubling the ratio factor doubles the required stock concentration, pushing a 20% nitrogen product past the solubility threshold. Switching to a 30% nitrogen formulation at a 1:200 ratio resolves this without changing the target delivery rate.
How the Calculation Works (Formula + Assumptions)
Show the calculation steps
Formula Steps in Plain Language
Step 1 - Oz per Gallon of Stock Solution
Oz/Gal(stock) = (Target PPM x Ratio Factor) / (Fertilizer N% x 75)
The constant 75 is derived from the unit relationship between pounds per gallon of water, the water weight constant of 8.34 lb/gal, and the conversion between PPM (milligrams per liter) and ounces per US gallon for a water-soluble salt. Target PPM and Ratio Factor are multiplied first because the injector dilutes the stock, so the stock must be proportionally concentrated. The result tells you how many ounces of dry fertilizer to dissolve in each gallon of stock solution.
Step 2 - Total Fertilizer for the Full Tank
Total Oz = Oz/Gal(stock) x Tank Size (gallons)
Multiply the per-gallon rate by total tank volume to get the batch weight. Convert to pounds by dividing by 16. This is a straight proportional scaling; no corrections for product density or dissolution loss are included.
Step 3 - Estimated EC of Finished Solution
EC (mS/cm) = Target PPM / PPM Scale
PPM scale values of 500, 700, or 640 correspond to the internal conversion factor of different EC meter brands. This produces the estimated conductivity of the diluted finished solution at the emitter, not the stock tank. Adding background source water EC to this figure gives the total EC the plant root zone receives.
Step 4 - Stock Tank Concentration (Informational)
Stock PPM = Target PPM x Ratio Factor
This shows the concentrated PPM inside the stock tank before dilution. It is not a measurement; it is a mathematical consequence of the dilution ratio and the target delivery rate.
Rounding Rules
Oz/Gal is rounded to two decimal places for mixing precision. Total ounces is rounded to one decimal; pounds to two. EC is rounded to two decimal places. Stock PPM is rounded to the nearest whole number.
Assumptions and Limits
- The formula applies only to fully water-soluble dry fertilizers. Granular slow-release or organic materials are outside its scope.
- The constant 75 in the denominator assumes standard water density at ambient temperature. Water above 85 degrees Fahrenheit will alter solubility but not the arithmetic output.
- EC estimates assume the fertilizer contributes as a single dissolved salt. Blended multi-nutrient fertilizers containing sulfates, chlorides, and nitrates simultaneously may read differently on a physical meter due to ion interaction effects.
- Source water background EC is excluded from the calculation. In areas with hard water above 0.5 mS/cm, the total root zone EC will be measurably higher than the computed EC Added value.
- The solubility warning threshold (16 oz/gal) is a conservative practical limit based on typical water-soluble fertilizer products. Actual maximum solubility varies by product formulation, water temperature, and agitation method.
- Target PPM input is treated as nitrogen PPM specifically. Phosphorus and potassium PPM values from the same fertilizer are not computed here; they require separate rate analysis using the full N-P-K label percentages.
- The chemical compatibility check covers the four most common field precipitation reactions. It does not cover every possible incompatible pairing or pH-dependent precipitation scenarios.
- Results are guidance values. Physical verification with a calibrated EC/TDS meter at the emitter is required before full-scale application.
Standards, Safety Checks, and "Secret Sauce" Warnings
Critical Warnings
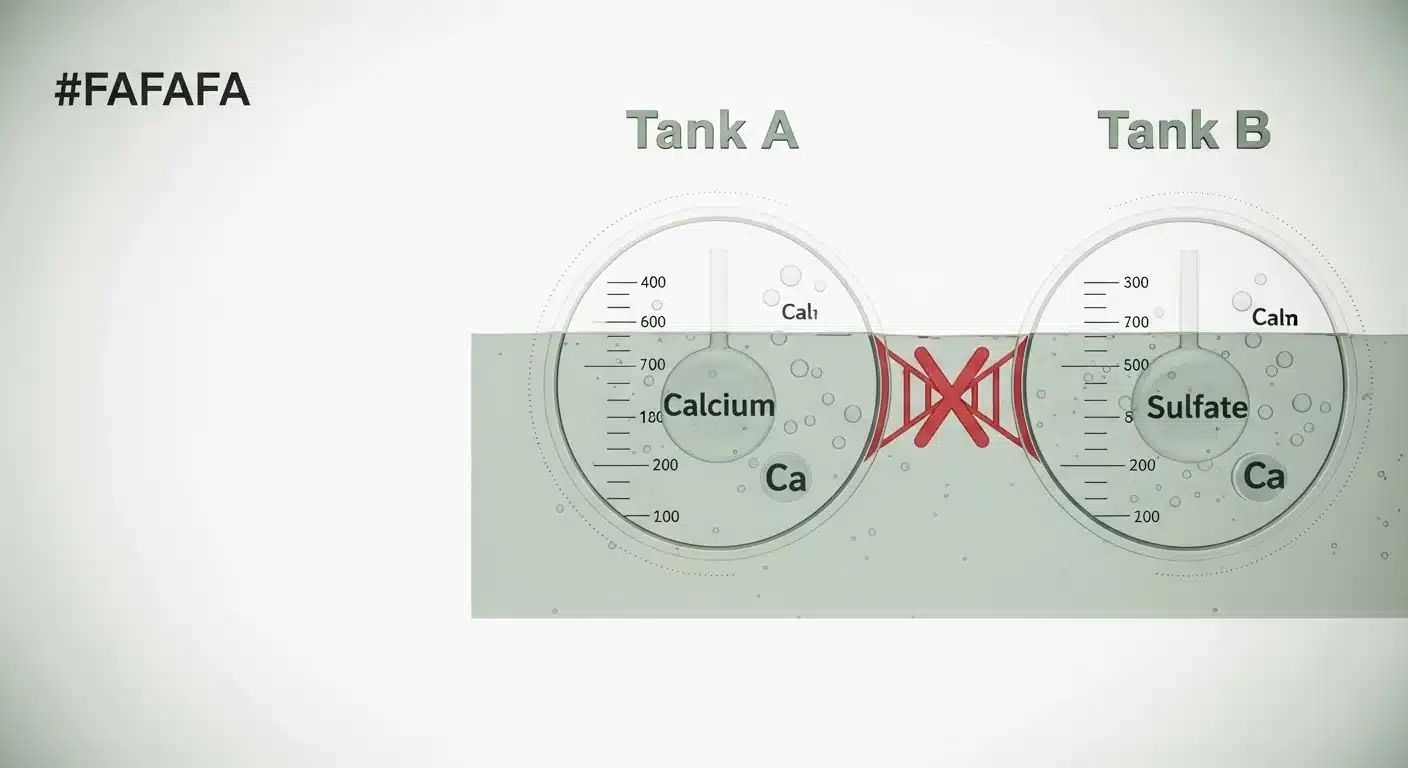
- The Gypsum Precipitation Trap: Calcium Nitrate and Magnesium Sulfate (Epsom Salt) must never be concentrated together in the same stock tank. In dilute finished solution the reaction is negligible, but at stock tank concentrations both ions are present in high enough molarity to precipitate calcium sulfate (gypsum) irreversibly. The result is a solid crystalline mass at the bottom of the tank, clogged emitter lines, and a destroyed batch. Commercial growers running two-tank A/B systems specifically separate calcium sources into Tank A and sulfate/magnesium sources into Tank B for this reason. The tool's chemical compatibility checkboxes enforce this check automatically before displaying results.
- EC Meter Scale Mismatch: Reading 300 PPM on a Hanna meter and then verifying with a Bluelab wand will show two different numbers from the same solution. The Hanna 500-scale meter multiplies EC by 0.5 to report PPM; the Bluelab 700-scale multiplies EC by 0.7. Neither reading is wrong, but comparing them directly without knowing which scale each meter uses produces false confidence or false alarm about concentration. Select the PPM scale matching your physical meter before accepting the EC output from this calculator. Growers who track feed programs over time using the fertilizer salt index calculator should note that salt index figures are also affected by the ion concentrations reported here.
- High PPM and Osmotic Stress: Delivering above 300 PPM nitrogen through a foliar or root-zone fertigation system without monitoring for salt accumulation increases the risk of osmotic stress in sensitive crops. The calculator flags this zone visually; it does not override the grower's judgment about crop-specific tolerance.
- Solubility Ceiling at High Ratios: Targeting 150 PPM at a 1:200 injector ratio requires a stock concentration twice as high as a 1:100 ratio at the same PPM target. With lower-nitrogen fertilizers, this can push the oz/gal requirement above practical solubility limits. The reference table above documents several such cases. One mitigation path is switching to a higher-nitrogen formulation; another is selecting a lower injector ratio if the unit supports it.
Minimum Standards
- Verify finished solution EC at the emitter, not at the stock tank or just after mixing, before applying to crop. The injector ratio is a mechanical dilution and can drift over time.
- Flush all fertigation lines with plain water at a pH of 6.0 to 6.5 at the end of each fertigation cycle to prevent fertilizer salt deposits in emitters and drip lines.
- When operating above 250 PPM nitrogen at any ratio, schedule a plain-water leaching run at minimum once per week in non-leaching root zones such as raised beds, containers, or greenhouse benches.
Competitor Trap: Most online "fertilizer injector calculators" compute only the ounces-per-gallon rate and stop. They omit the critical relationship between ratio factor and solubility, ignore PPM-scale selection entirely, and say nothing about chemical compatibility in concentrated stock solutions. A grower who blindly follows the oz/gal output at a 1:200 ratio using a low-nitrogen product will consistently mix batches that are near or above solubility, producing inconsistent concentration as undissolved material settles. The tool on this page addresses all three gaps. For programs where residual soil salt accumulation from irrigation is a concern, the soil leaching requirement calculator provides a complementary check on flush volume.
Common Mistakes and Fixes
Mistake: Confusing Target PPM with Stock Tank PPM
The number most growers want at the end of the hose is the root-zone delivery concentration, not the stock tank concentration. Entering the stock tank PPM into the "Target Nitrogen PPM" field produces a result that is already pre-multiplied by the ratio factor, yielding an output concentration orders of magnitude higher than intended. The calculator's "Target PPM" field expects the final diluted value at the plant root, not the concentrated value in the reservoir.
Fix: Before entering a PPM value, confirm it comes from a crop nutrition guide or feed schedule expressed as delivered concentration, not stock concentration.
Mistake: Using the Wrong N Percentage From a Blended Fertilizer
A fertilizer labeled 15-5-15 has 15% nitrogen. Entering 35 because you added all three N-P-K numbers is a common entry error that triples the denominator and produces a concentration result one-third of what is actually needed. The Nitrogen Percentage field requires only the first number from the guaranteed analysis. For programs using multiple products and blended nutrient ratios, the nitrogen calculator helps isolate the elemental N contribution from each product before it reaches this field.
Fix: Read only the first N-P-K digit from the fertilizer label and enter that number alone.
Mistake: Assuming Injector Ratio Is Fixed and Accurate Without Calibration
Proportioner injectors use a venturi or piston mechanism to draw stock solution. Wear, debris in the suction line, changes in line pressure, and water temperature all affect actual draw rate over time. A Dosatron set to 1:100 that has not been calibrated in two seasons may be drawing at 1:85 or 1:115. This directly shifts the actual PPM delivery away from the calculated target without any visible sign at the injector dial.
Fix: Calibrate injector output against a measured water volume and timed collection test at least once per growing season, and after any pressure or line change.
Mistake: Ignoring Background Water EC Before Setting a Target PPM
The EC Added value this calculator produces represents only the fertilizer's contribution to conductivity. Water from municipal supplies, wells, or surface sources already carries measurable EC from dissolved minerals. Adding 0.30 mS/cm from a fertilizer program to source water already at 0.45 mS/cm produces a delivered EC of 0.75 mS/cm, which is materially different from the 0.30 mS/cm the calculator shows. Sensitive crops in closed irrigation systems accumulate this difference over multiple cycles.
Fix: Measure source water EC with a calibrated meter before any fertigation cycle and add it manually to the calculator's EC output to determine actual root zone conductivity.
Mistake: Mixing Calcium and Sulfate Sources in One Stock Tank
This is addressed in the warnings above but is repeated here because it remains the most common and costly fertigation error in field crop production. The incompatibility is not visible until precipitation has already occurred, and the resulting gypsum mass cannot be redissolved by any practical field method. Tank A and Tank B separation in two-part fertilizer programs exists precisely because of this reaction chemistry, not as a marketing choice by fertilizer manufacturers.
Fix: Use the chemical compatibility checkboxes in the tool before mixing. If running a single-tank system, verify that your fertilizer product does not contain both calcium and sulfate fractions in the same formulation at high concentration.
Next Steps in Your Workflow
Once you have a confirmed oz/gal figure and a verified EC target, the next step is confirming the complete nutrient profile the program delivers, not just nitrogen. A fertilizer delivering 150 PPM nitrogen from a 20-20-20 product simultaneously delivers phosphorus and potassium at rates that may or may not match what the crop needs at its current growth stage. Adjusting to a custom ratio formulation, or blending two products to shift the N-P-K balance, requires cross-checking all three element delivery rates. The NPK fertilizer calculator handles multi-product blending math and allows you to set a full three-element target rather than nitrogen alone.
For greenhouse and container systems that run continuous fertigation without significant leaching between cycles, salt accumulation in the root zone becomes a management issue within a few weeks at moderate PPM rates. Knowing the leach fraction you need to maintain a safe root zone EC requires different math than mixing the stock batch. The soil leaching requirement calculator takes your target root zone EC and source water EC as inputs and returns the minimum leach fraction to maintain acceptable salt balance over time.
FAQ
What is the difference between a Dosatron and a Mazzei venturi injector for calculating stock concentration?
Both injector types dilute stock solution at a fixed ratio, so the same stock concentration formula applies to either. The practical difference is that Dosatron units are positive-displacement and maintain ratio across varying pressures, while Mazzei venturi injectors are pressure-differential-dependent and ratio accuracy can shift with line pressure changes. This affects injector calibration frequency but not the concentration math.
Why does my physical EC meter reading not match the EC output from this calculator?
Three reasons account for most mismatches: wrong PPM scale selection (500 vs. 700 vs. 640), background EC in source water not included in the calculation, or injector draw rate drift from rated ratio. Measure source water EC separately, select the scale matching your meter brand, and verify the injector is actually drawing at the stated ratio.
Can this calculator be used for liquid fertilizer concentrates instead of dry fertilizers?
No. The formula uses a constant (75) derived from the density relationship of dry water-soluble fertilizers dissolved in water. Liquid concentrates have their own density and nutrient-per-volume specifications that require a different calculation path. The fertilizer dilution calculator linked above handles liquid concentrate inputs.
What PPM range is safe for lettuce and other leafy greens?
Leafy greens and herbs are generally sensitive to salt accumulation. Nitrogen delivery rates between 75 and 150 PPM are typical for leafy crops in active growth. Rates above 200 PPM nitrogen in continuous-feed systems can produce tip burn in lettuce and margin scorch in sensitive herbs, particularly in low-humidity environments where transpiration concentrates root zone salts faster.
Does the calculator account for phosphorus and potassium delivery, or only nitrogen?
Only nitrogen is computed here, because nitrogen percentage is the universally consistent variable across water-soluble fertilizer labels for dosatron dilution ratio math. Phosphorus and potassium delivery rates from the same fertilizer can be inferred proportionally from the N-P-K ratio, but they require separate calculation to hit specific crop targets for those elements.
How often should a stock tank be replaced versus topped off between fertigation cycles?
Topping off a stock tank with fresh water only dilutes the remaining concentrate, producing an unknown and variable concentration until the tank is fully remixed. Best practice is to drain and clean the tank completely before each fresh batch, then mix to the calculated rate. Concentration drift from evaporation and partial refills is a common cause of inconsistent PPM delivery across a growing season.
Conclusion
Proportioner-based fertigation is reliable when the inputs are accurate and the chemistry is compatible. This fertilizer injector calculator closes two gaps that most available tools leave open: it connects the dilution ratio to the solubility boundary, showing where a given combination of ratio and target PPM pushes the stock concentration past the practical dissolution limit, and it enforces the calcium-sulfate compatibility check before a grower commits a batch to an irreversible gypsum reaction. Those two features, not the basic oz/gal math, are where value for the commercial grower lives.
The single most expensive mistake in stock solution mixing is not an arithmetic error; it is selecting a Calcium Nitrate and Magnesium Sulfate combination without knowing the precipitation chemistry and watching a full tank solidify within hours of mixing. The calculator's chemical compatibility section exists specifically to prevent that scenario. Double-check your fertilizer selections in the Tank A and Tank B columns every time you change products, and verify the finished solution EC at the emitter with a calibrated meter before applying to crop. For programs that push nitrogen delivery above 250 PPM, the fertilizer spreader calibration calculator provides complementary precision checks when transitioning excess fertilizer inventory to dry broadcast applications.
Lead Data Architect
Umer Hayiat
Founder & Lead Data Architect at TheYieldGrid. I bridge the gap between complex agronomic data and practical growing, transforming verified agricultural science into accessible, mathematically precise tools and guides for serious growers.
View all tools & guides by Umer Hayiat →